EX-99.2
Published on August 12, 2026
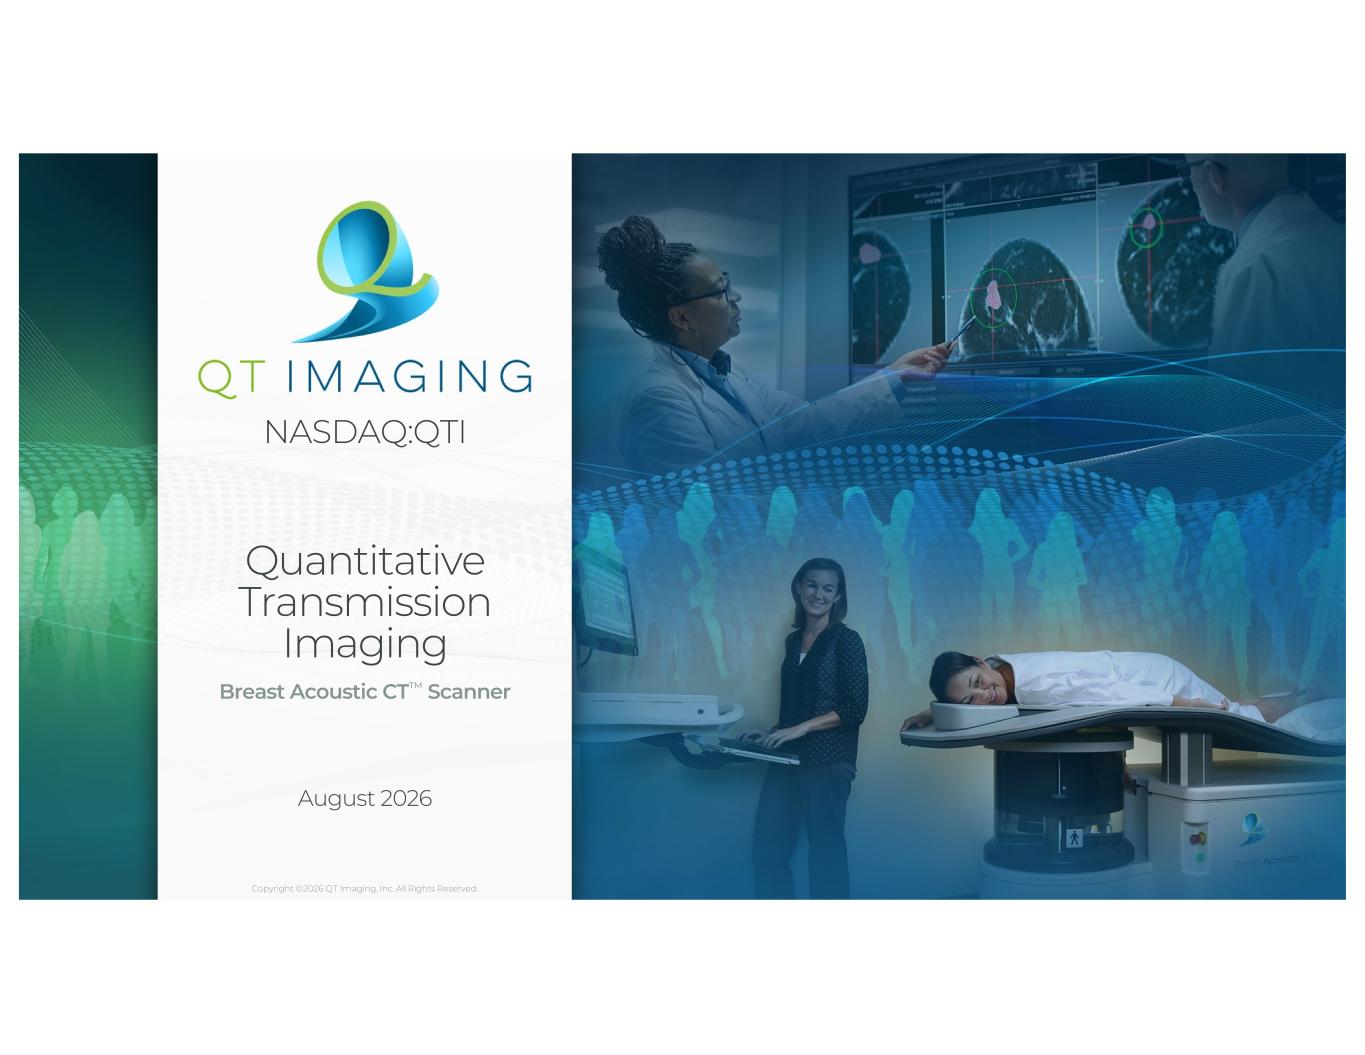
Quantitative Transmission Imaging Breast Acoustic CT™ Scanner August 2026 NASDAQ:QTI Copyright ©2026 QT Imaging, Inc. All Rights Reserved.
2 Disclaimer ABOUT THIS PRESENTATION This investor presentation (this “Presentation”) is provided for informational purposes only. The information contained herein does not purport to be all-inclusive and neither QT Imaging Holdings, Inc. (the “Company”, “QT Imaging Holdings”, “QTI”), nor its respective directors, officers, employees, agents, advisors or affiliates, including QT Imaging, Inc. (“QT Imaging”), makes any representation or warranty, express or implied, as to the accuracy, completeness or reliability of the information contained in this Presentation, which has not been verified and is subject to change at any time. Viewers of this Presentation should each make their own evaluation of QT Imaging Holdings and of the relevance and accuracy of the information and should make such other investigations as they deem necessary. To the fullest extent permitted by law, no responsibility or liability whatsoever is accepted by QT Imaging Holdings, or its directors, officers, employees, agents, advisors or affiliates for any loss howsoever arising, directly or indirectly, from any use of this Presentation or such information or opinions contained herein or otherwise arising in connection herewith. This Presentation does not constitute (i) a solicitation of a proxy, consent or authorization with respect to any securities or (ii) an offer to sell, a solicitation of an offer to buy, or a recommendation to purchase any security of QT Imaging Holdings, or any of its affiliates, nor shall there be any sale, issuance or transfer of securities in any jurisdiction where, or to any person to whom, such offer, solicitation or sale would be unlawful. You should not construe the contents of this Presentation as legal, tax, accounting or investment advice or a recommendation. You should consult your own counsel and tax and financial advisors as to legal and related matters concerning the matters described herein, and, by accepting this Presentation, you confirm that you are not relying upon the information contained herein to make any decision. On June 6, 2017, the U.S. Food and Drug Administration ("FDA") in response to QT Imaging’s Section 510(k) Summary of Safety and Effectiveness premarket notification under the Food, Drug and Cosmetic Act, determined that the QT Breast Scanner is substantially equivalent to the predicate device. Our use of the words “safe”, “safety”, “effectiveness”, and “efficacy” in relation to the QT Breast Scanner in this Presentation and all other QT Imaging related documents is limited to the context of the Section 510(K) Summary of Safety and Effectiveness that was reviewed and responded to by the FDA. TRADEMARKS AND INTELLECTUAL PROPERTY All trademarks, service marks, and trade names of QT Imaging Holdings or its affiliates used herein are trademarks, service marks, or registered trade names of QT Imaging Holdings or its affiliates, as noted herein. Any other product, company names, or logos mentioned herein are the trademarks and/or intellectual property of their respective owners, and their use is not intended to, and does not imply, a relationship with QT Imaging Holdings or its affiliates, or an endorsement or sponsorship by or of QT Imaging Holdings or its affiliates. Solely for convenience, the trademarks, service marks and trade names referred to in this presentation may appear without the ®, TM or SM symbols, but such references are not intended to indicate, in any way, that QT Imaging Holdings or its affiliates will not assert, to the fullest extent under applicable law, their rights or the right of the applicable licensor to these trademarks, service marks and trade names. NON-GAAP FINANCIAL MEASURES EBITDA is defined as loss before interest expense, income tax expense, depreciation and amortization. Adjusted EBITDA is defined as EBITDA further adjusted for other expense (income), change in fair value of the warrant, derivative, and earnout liabilities, loss on issuance of debt, loss on debt extinguishment and modification, and stock-based compensation. Similar excluded expenses may be incurred in future periods when calculating these measures. QT Imaging believes these non-GAAP measures of financial results provide useful information to management and investors regarding certain financial and business trends relating to the Company’s financial condition and results of operations. QT Imaging believes that the use of these non-GAAP financial measures provides an additional tool for investors to use in evaluating projected operating results and trends and in comparing QT Imaging’s financial measures with other similar companies, many of which present similar non-GAAP financial measures to investors. Certain of the financial metrics in this presentation can be found in QT Imaging’s Form 8-K filed with the U.S. Securities and Exchange Commission (the “SEC”) on August 12, 2026, including a reconciliation of EBITDA and Adjusted EBITDA. Copyright ©2026 QT Imaging, Inc. All Rights Reserved
3 Disclaimer FORWARD LOOKING STATEMENTS Certain statements included in this Presentation that are not historical facts are forward-looking statements for purposes of the safe harbor provisions under the United States Private Securities Litigation Reform Act of 1995. Forward-looking statements generally are accompanied by words such as “has the potential to”, “believe”, “may”, “will”, “estimate”, “continue”, “anticipate”, “intend”, “expect”, “should”, “would”, “plan”, “predict”, “potential”, “seem”, “seek”, “future”, “outlook”, and similar expressions that indicate or predict future events or trends that are not statements of historical matters. These forward looking statements include, but are not limited to, the potential impact on existing medical technology, the company’s technology, including, the evolution of the Company into a scalable imaging platform combining proprietary hardware, advanced image reconstruction software, and AI-powered clinical decision tools to address the growing need for precision in breast health and the performance of software enhancements, product offerings, including QTI Cloud Platform and SaaS pricing model, business prospects, revenue, client adoptions, commercialization, including in Saudi Arabia and UAE, timing of reimbursement codes, projections of market opportunity, regulatory approvals and statements regarding estimates and forecasts of other financial and performance metrics. These statements are based on various assumptions, whether or not identified in this Presentation, and on the current expectations of QT Imaging Holdings’ management and are not predictions of actual performance. These forward-looking statements are provided for illustrative purposes only and are not circumstances intended to serve as, and must not be relied on by any investor as, a guarantee, an assurance, a prediction or a definitive statement of fact or probability. In addition, statements regarding the Company’s products, technology, and market opportunity reflect the beliefs and opinions of QT Imaging Holdings’ management on the relevant subject as of this Presentation. Actual events and circumstances are difficult or impossible to predict and will differ from assumptions. Many actual events and circumstances are beyond the control of QT Imaging Holdings. These forward-looking statements are subject to a number of risks and uncertainties, including changes in domestic and foreign business, market, financial, political and legal conditions; risks related to the rollout of QT Imaging Holdings’ business and the timing of expected business milestones; the demand for QT Imaging Holdings’ products and services; the ability of QT Imaging Holdings to increase sales of its output products in accordance with its plans; issues that could arise with respect to the manufacture of QT scanners by CMSC; the desire of customers and service recipients to continue engaging QT Imaging Holdings; the effects of competition on QT Imaging Holdings’ future business, changes in the Company’s strategy, future operations, financial positions, and product development timeline. If any of these risks materialize or our assumptions prove incorrect, actual results could differ materially from the results implied by these forward-looking statements. There may be additional risks that QT Imaging Holdings presently does not know or believes is immaterial that could also cause actual results to differ from those contained in the forward-looking statements. In addition, forward-looking statements reflect QT Imaging Holdings’ expectations, plans or forecasts of future events and views as of the date of this Presentation. QT Imaging Holdings anticipates that subsequent events and developments will cause its assessments to change. However, while QT Imaging Holdings may elect to update these forward-looking statements at some point in the future, its specifically disclaims any obligation to do so. These forward-looking statements should not be relied upon as representing QT Imaging Holdings’ assessments as of any date subsequent to the date of this Presentation. Accordingly, undue reliance should not be placed upon the forward-looking statements. RISK FACTORS An investment in our common stock involves a high degree of risk. The risk factors described below are not intended to be exhaustive and are not the only risks facing us. Additional risks not currently known to us or that we currently deem to be immaterial also may materially adversely affect our business, financial condition, results of operations and cash flows in future periods or are not identified because they are generally common to businesses. The occurrence of one of more of the events or circumstances described in these risk factors, along or in combination with other events or circumstances, could harm our business, financial condition, results of operations, and growth prospects. In such event, the market price of our common stock could decline, and you may lose all or part of your investment. The following should be read in conjunction with the respective consolidated financial statements of the Company, and the notes to the consolidated financial statements included therein. Risk factors include, but are not limited to: • We are a development-stage company with limited operating history and significant losses since inception which may make it difficult to evaluate prospects for our future viability and predict our future performance. We may never be able to effectuate our business plan or achieve any meaningful revenue or reach profitability. • We may not be able to successfully execute our business model. • We have a limited operating history. If we successfully commercially launch the QTI Breast Acoustic CT Scanner, as well as products under development that are cleared by the FDA and other regulatory agencies, and they do not achieve widespread market acceptance, we will not be able to generate the revenue necessary to support our business. • We may need to raise additional capital, which may not be available on favorable terms, if at all, and which may cause dilution to stockholders, restrict our operations or adversely affect our ability to operate our business. • Our ability to generate the amount of cash needed to pay interest and principal on any indebtedness and our ability to refinance all or a portion of our indebtedness or obtain additional financing depends on many factors beyond our control. • Our debt agreements contain restrictions that may limit our flexibility in operating our business. • We are highly dependent on the successful development, marketing and sale of our breast imaging device and on other products and product candidates which are still in the development stage. Copyright ©2026 QT Imaging, Inc. All Rights Reserved
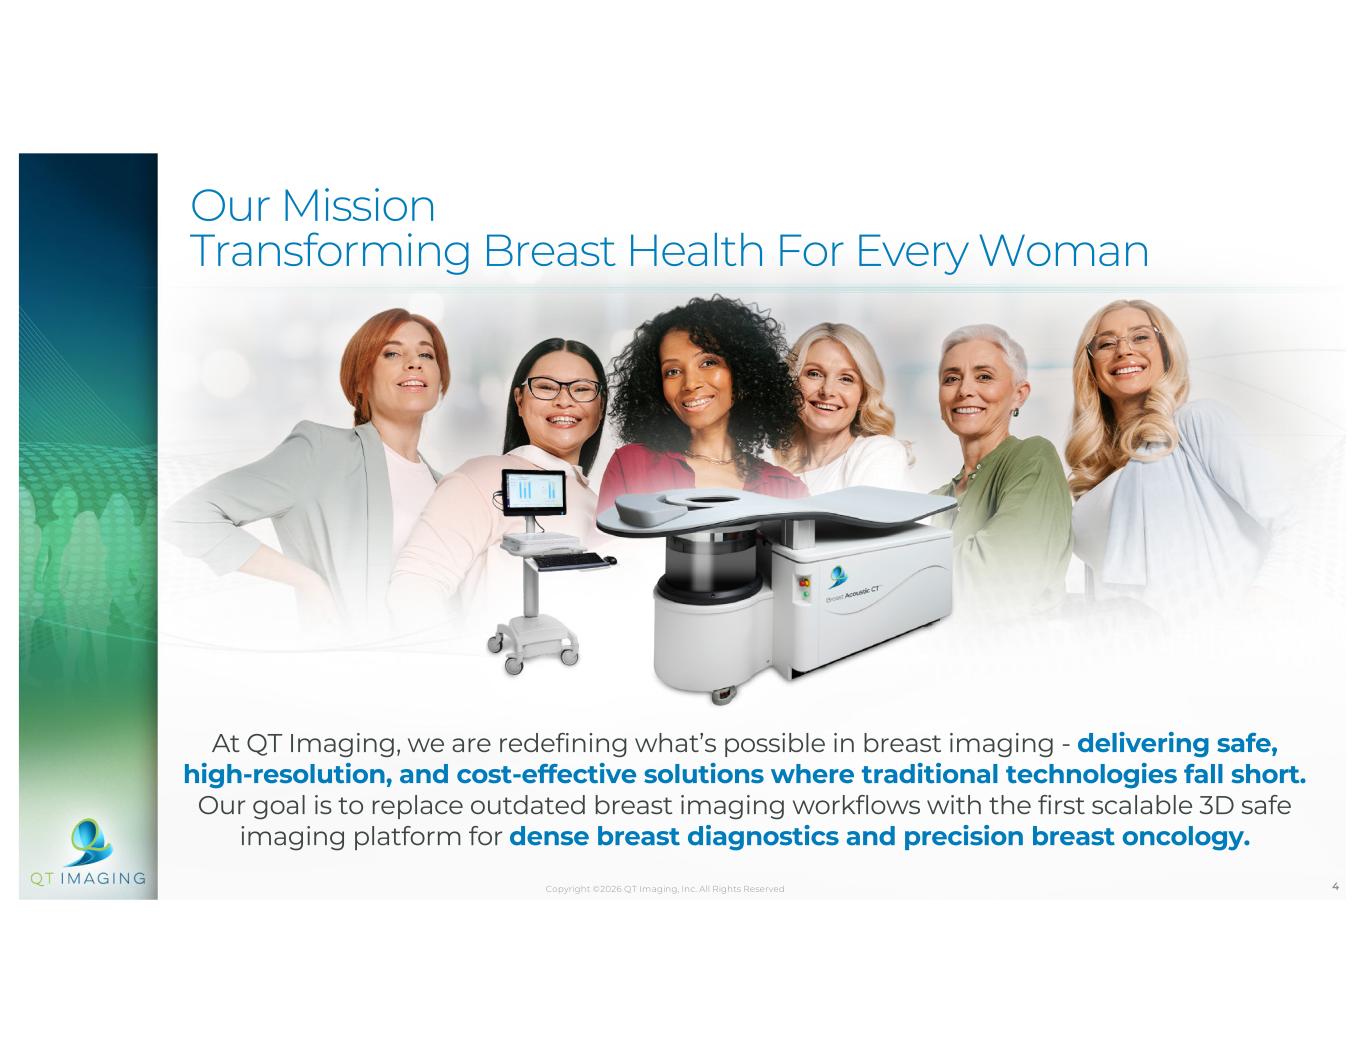
4 Our Mission Transforming Breast Health For Every Woman At QT Imaging, we are redefining what’s possible in breast imaging - delivering safe, high-resolution, and cost-effective solutions where traditional technologies fall short. Our goal is to replace outdated breast imaging workflows with the first scalable 3D safe imaging platform for dense breast diagnostics and precision breast oncology. Copyright ©2026 QT Imaging, Inc. All Rights Reserved
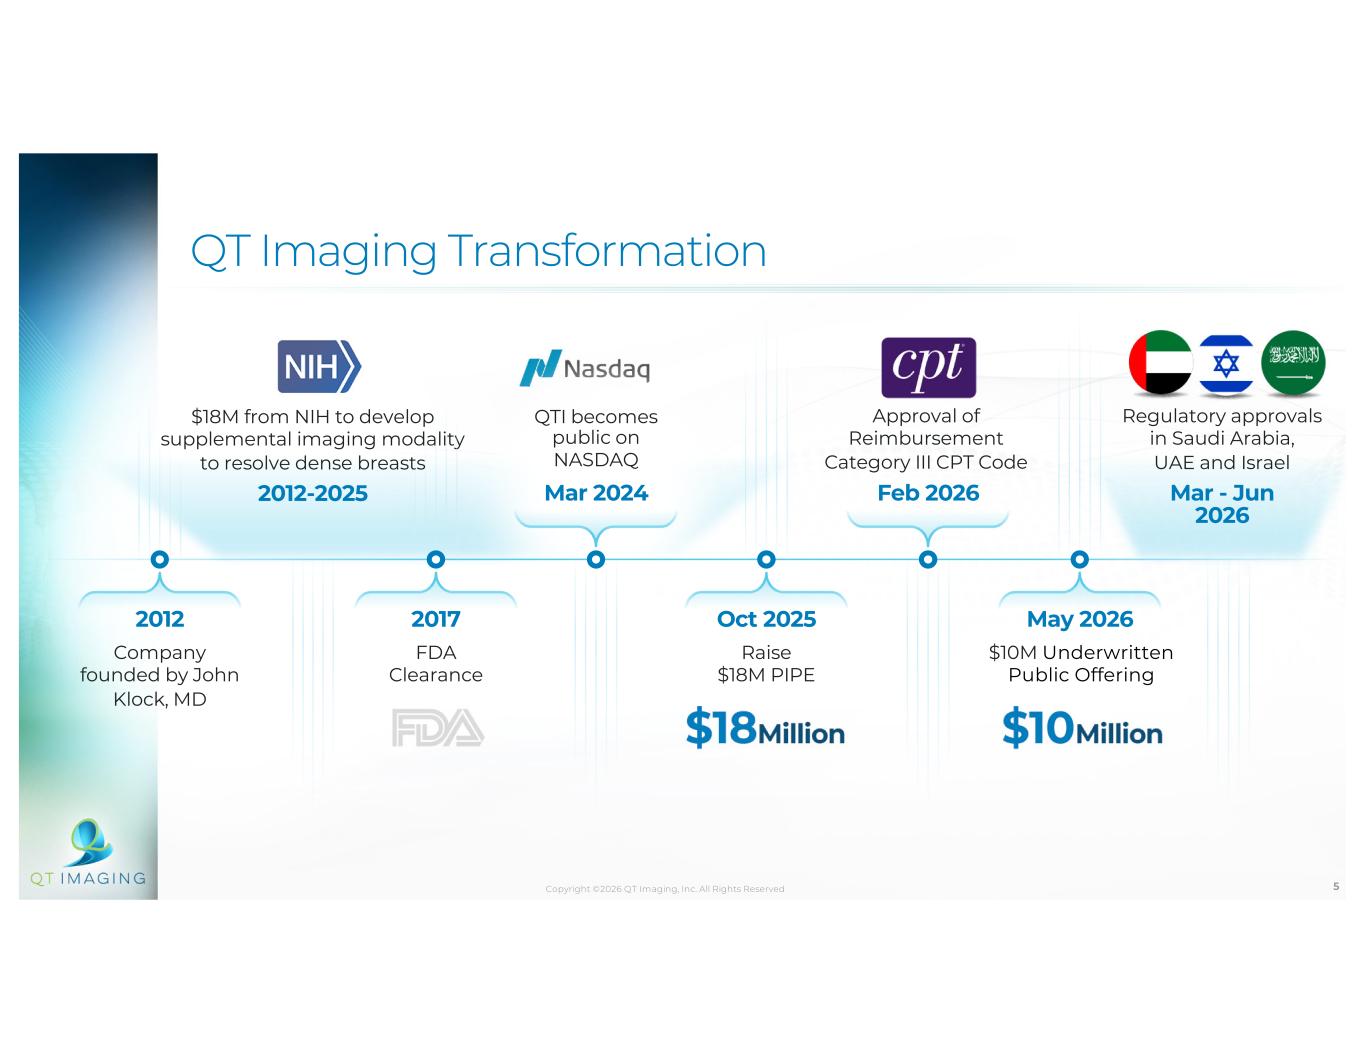
5 $18M from NIH to develop supplemental imaging modality to resolve dense breasts 2012-2025 QT Imaging Transformation Company founded by John Klock, MD 2012 FDA Clearance 2017 Raise $18M PIPE Oct 2025 $10M Underwritten Public Offering May 2026 QTI becomes public on NASDAQ Mar 2024 Approval of Reimbursement Category III CPT Code Feb 2026 Regulatory approvals in Saudi Arabia, UAE and Israel Mar - Jun 2026 Copyright ©2026 QT Imaging, Inc. All Rights Reserved
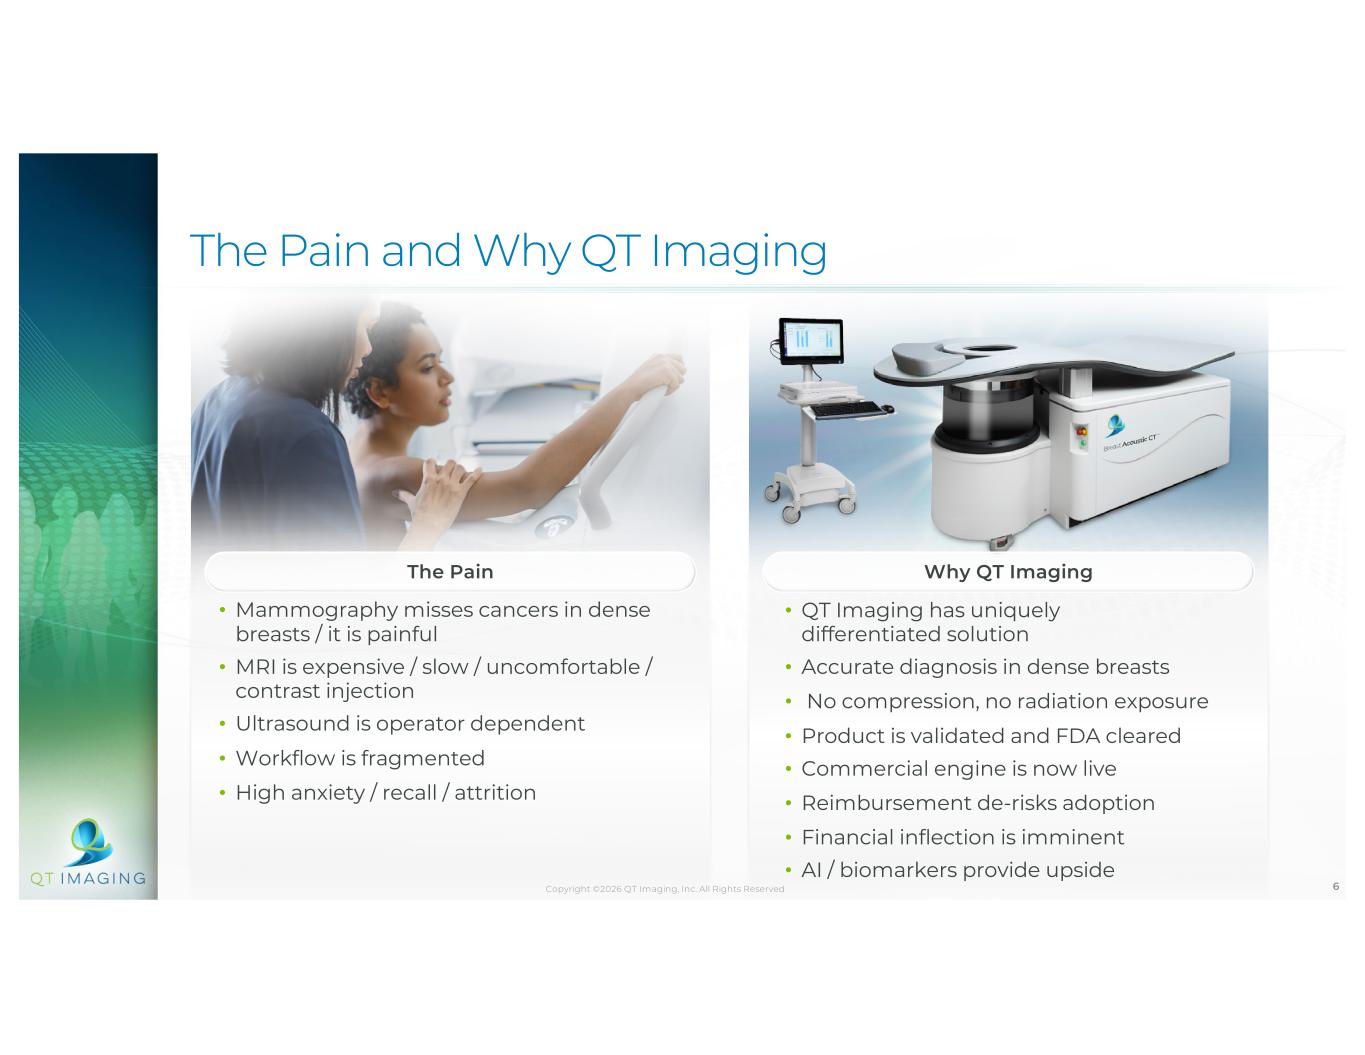
6 The Pain and Why QT Imaging The Pain Why QT Imaging Copyright ©2026 QT Imaging, Inc. All Rights Reserved • Mammography misses cancers in dense breasts / it is painful • MRI is expensive / slow / uncomfortable / contrast injection • Ultrasound is operator dependent • Workflow is fragmented • High anxiety / recall / attrition • QT Imaging has uniquely differentiated solution • Accurate diagnosis in dense breasts • No compression, no radiation exposure • Product is validated and FDA cleared • Commercial engine is now live • Reimbursement de-risks adoption • Financial inflection is imminent • AI / biomarkers provide upside
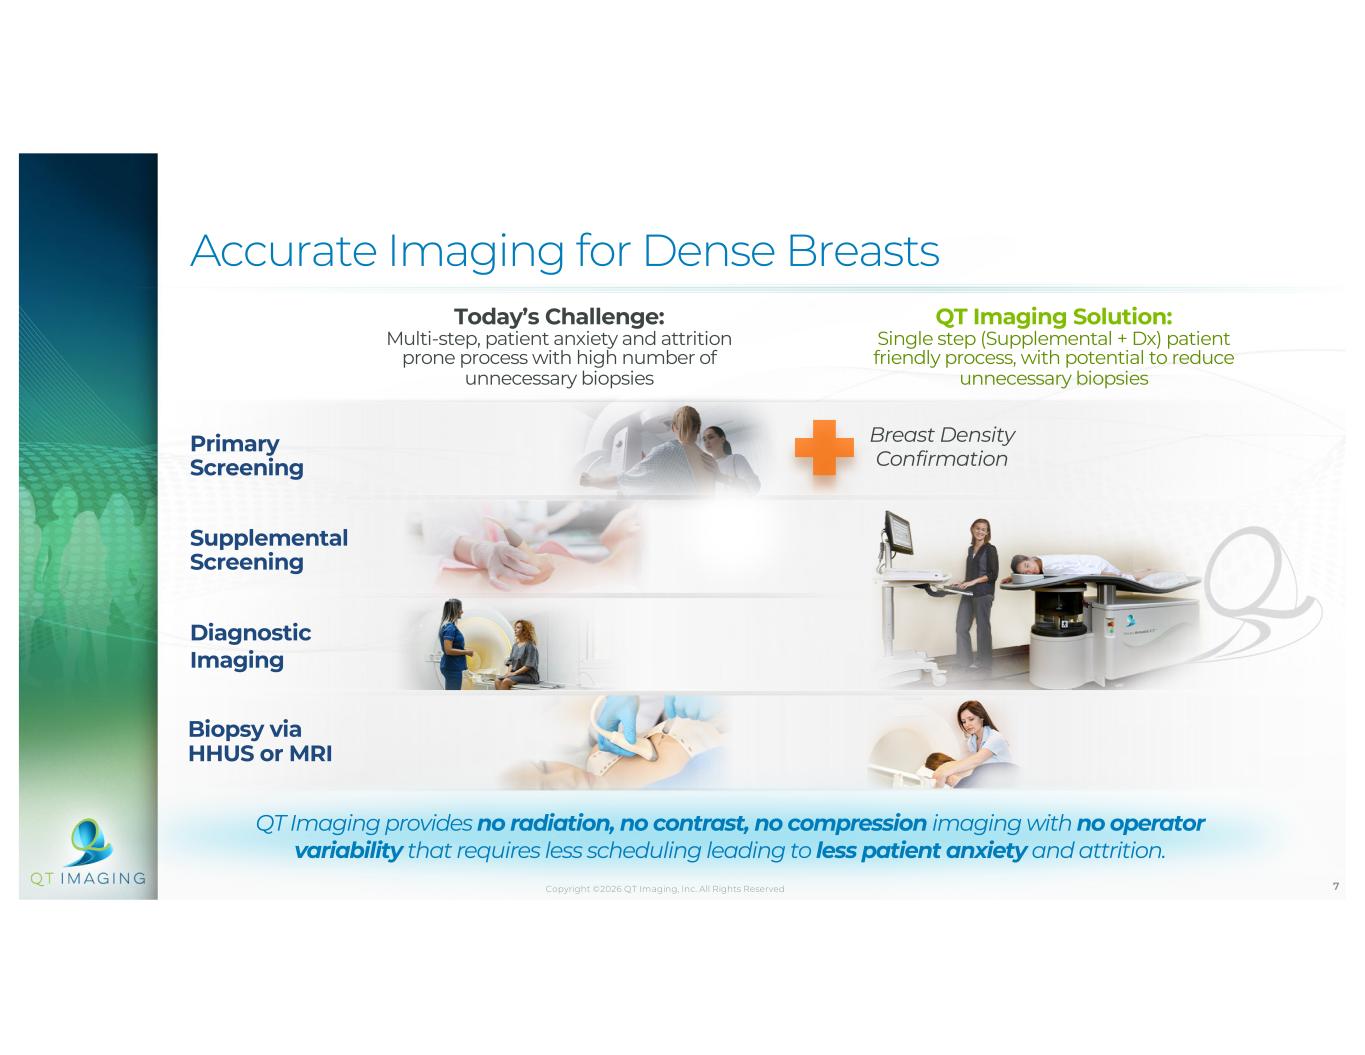
7 Primary Screening Today’s Challenge: Multi-step, patient anxiety and attrition prone process with high number of unnecessary biopsies Accurate Imaging for Dense Breasts Breast Density Confirmation Supplemental Screening QT Imaging Solution: Single step (Supplemental + Dx) patient friendly process, with potential to reduce unnecessary biopsies QT Imaging provides no radiation, no contrast, no compression imaging with no operator variability that requires less scheduling leading to less patient anxiety and attrition. Biopsy via HHUS or MRI Diagnostic Imaging Copyright ©2026 QT Imaging, Inc. All Rights Reserved
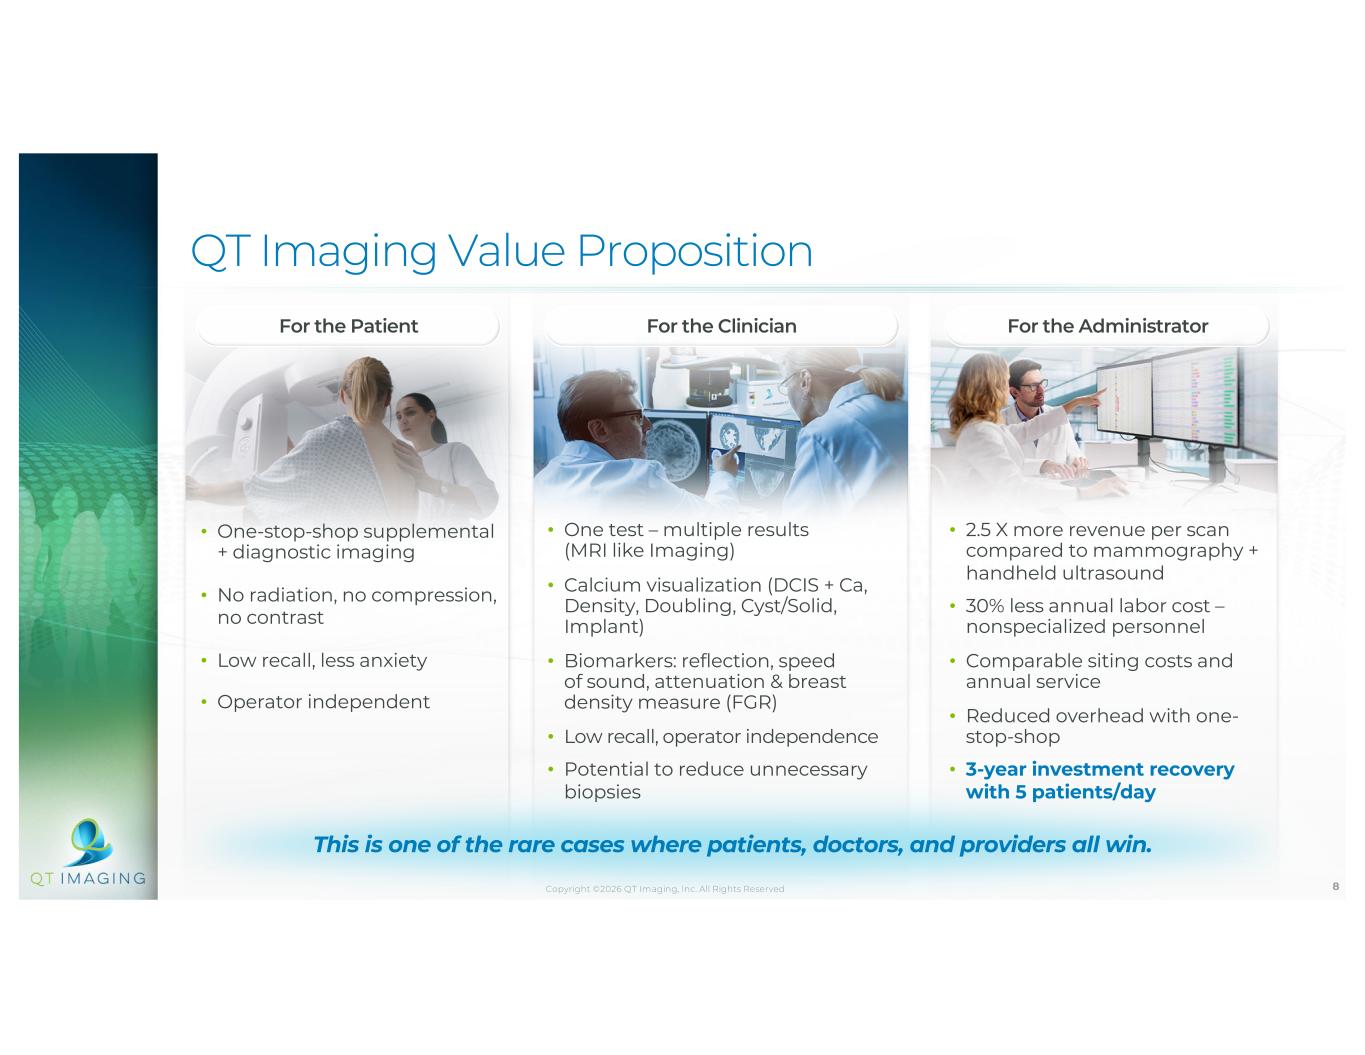
8 QT Imaging Value Proposition • One-stop-shop supplemental + diagnostic imaging • No radiation, no compression, no contrast • Low recall, less anxiety • Operator independent • One test – multiple results (MRI like Imaging) • Calcium visualization (DCIS + Ca, Density, Doubling, Cyst/Solid, Implant) • Biomarkers: reflection, speed of sound, attenuation & breast density measure (FGR) • Low recall, operator independence • Potential to reduce unnecessary biopsies • 2.5 X more revenue per scan compared to mammography + handheld ultrasound • 30% less annual labor cost – nonspecialized personnel • Comparable siting costs and annual service • Reduced overhead with one- stop-shop • 3-year investment recovery with 5 patients/day This is one of the rare cases where patients, doctors, and providers all win. For the Patient For the Clinician For the Administrator Copyright ©2026 QT Imaging, Inc. All Rights Reserved
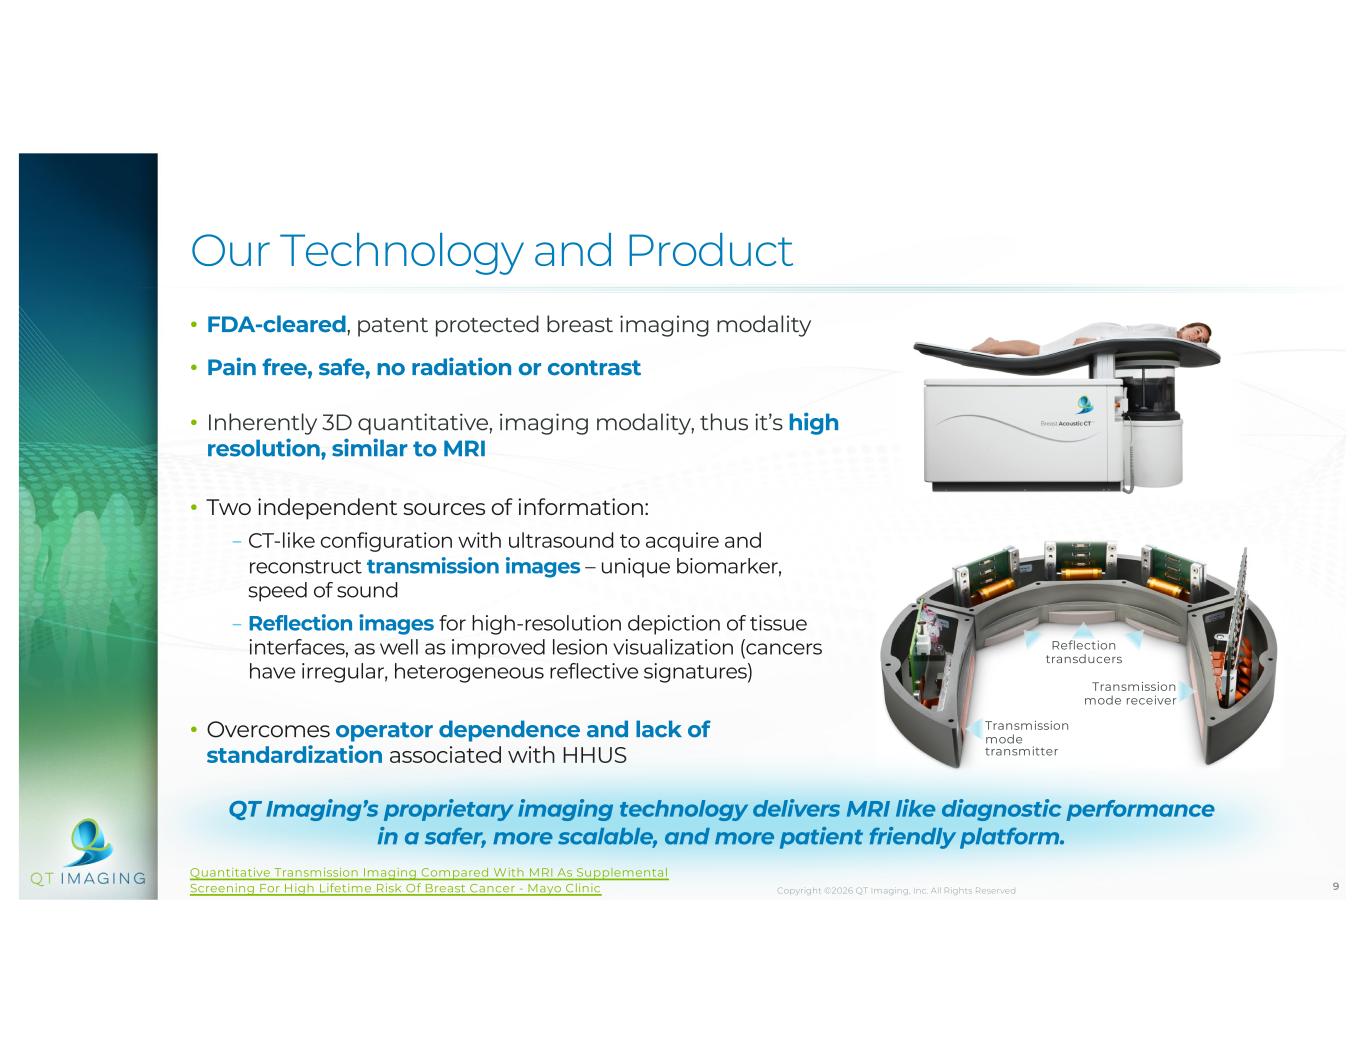
9 Reflection transducers Transmission mode receiver Transmission mode transmitter Our Technology and Product • FDA-cleared, patent protected breast imaging modality • Pain free, safe, no radiation or contrast • Inherently 3D quantitative, imaging modality, thus it’s high resolution, similar to MRI • Two independent sources of information: − CT-like configuration with ultrasound to acquire and reconstruct transmission images – unique biomarker, speed of sound − Reflection images for high-resolution depiction of tissue interfaces, as well as improved lesion visualization (cancers have irregular, heterogeneous reflective signatures) • Overcomes operator dependence and lack of standardization associated with HHUS QT Imaging’s proprietary imaging technology delivers MRI like diagnostic performance in a safer, more scalable, and more patient friendly platform. Quantitative Transmission Imaging Compared With MRI As Supplemental Screening For High Lifetime Risk Of Breast Cancer - Mayo Clinic Copyright ©2026 QT Imaging, Inc. All Rights Reserved
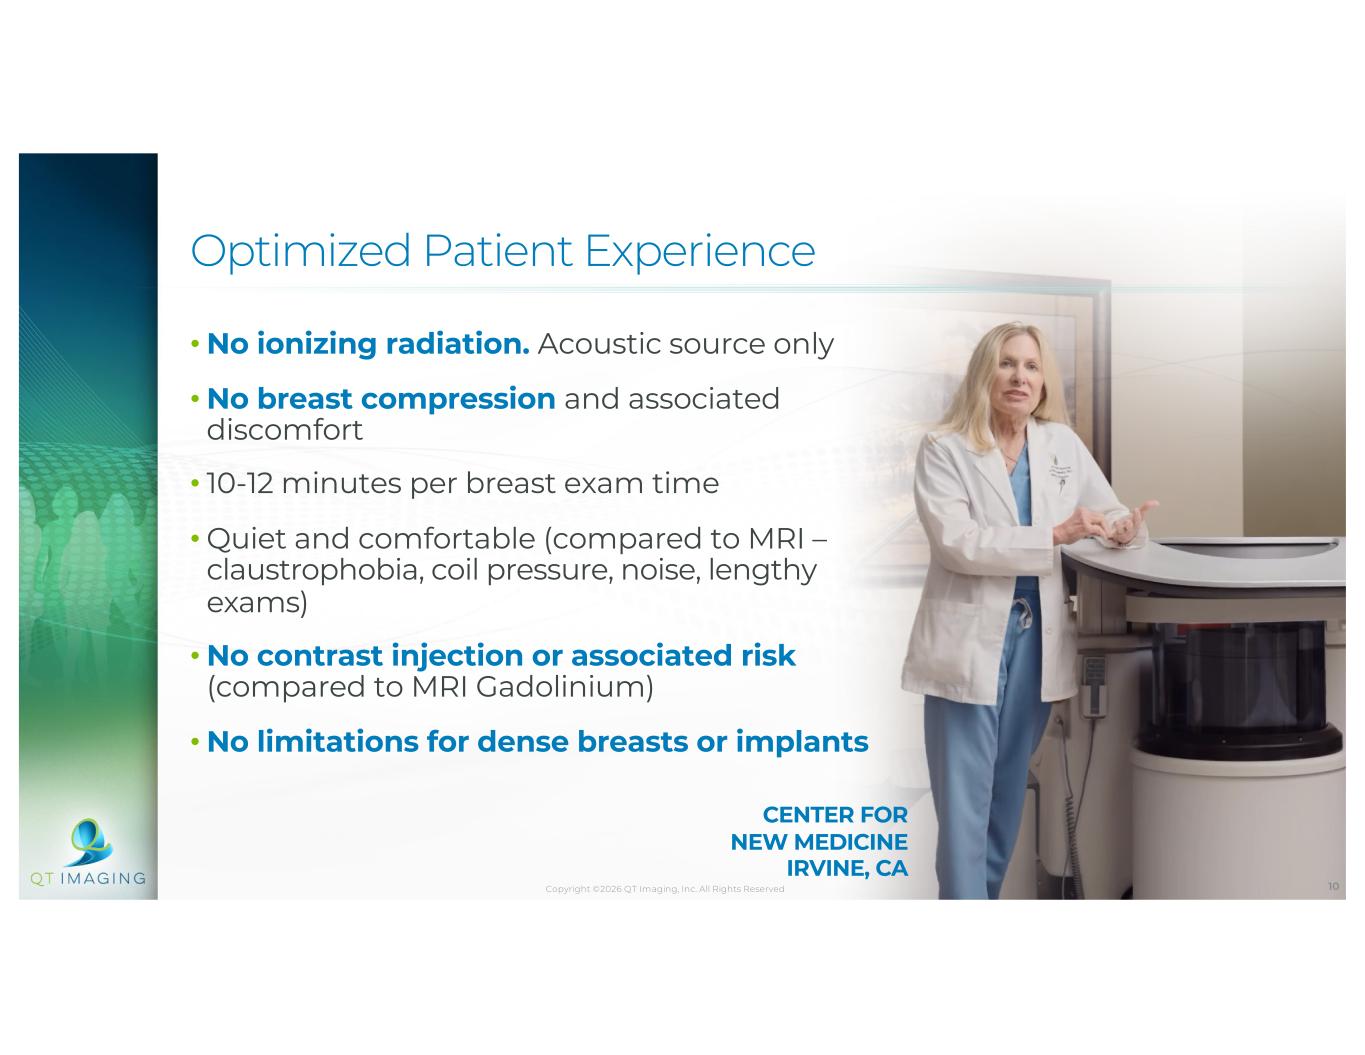
10 Optimized Patient Experience •No ionizing radiation. Acoustic source only •No breast compression and associated discomfort • 10-12 minutes per breast exam time •Quiet and comfortable (compared to MRI – claustrophobia, coil pressure, noise, lengthy exams) •No contrast injection or associated risk (compared to MRI Gadolinium) •No limitations for dense breasts or implants CENTER FOR NEW MEDICINE IRVINE, CA Copyright ©2026 QT Imaging, Inc. All Rights Reserved
Our Market, Why Now, and How It Fits In
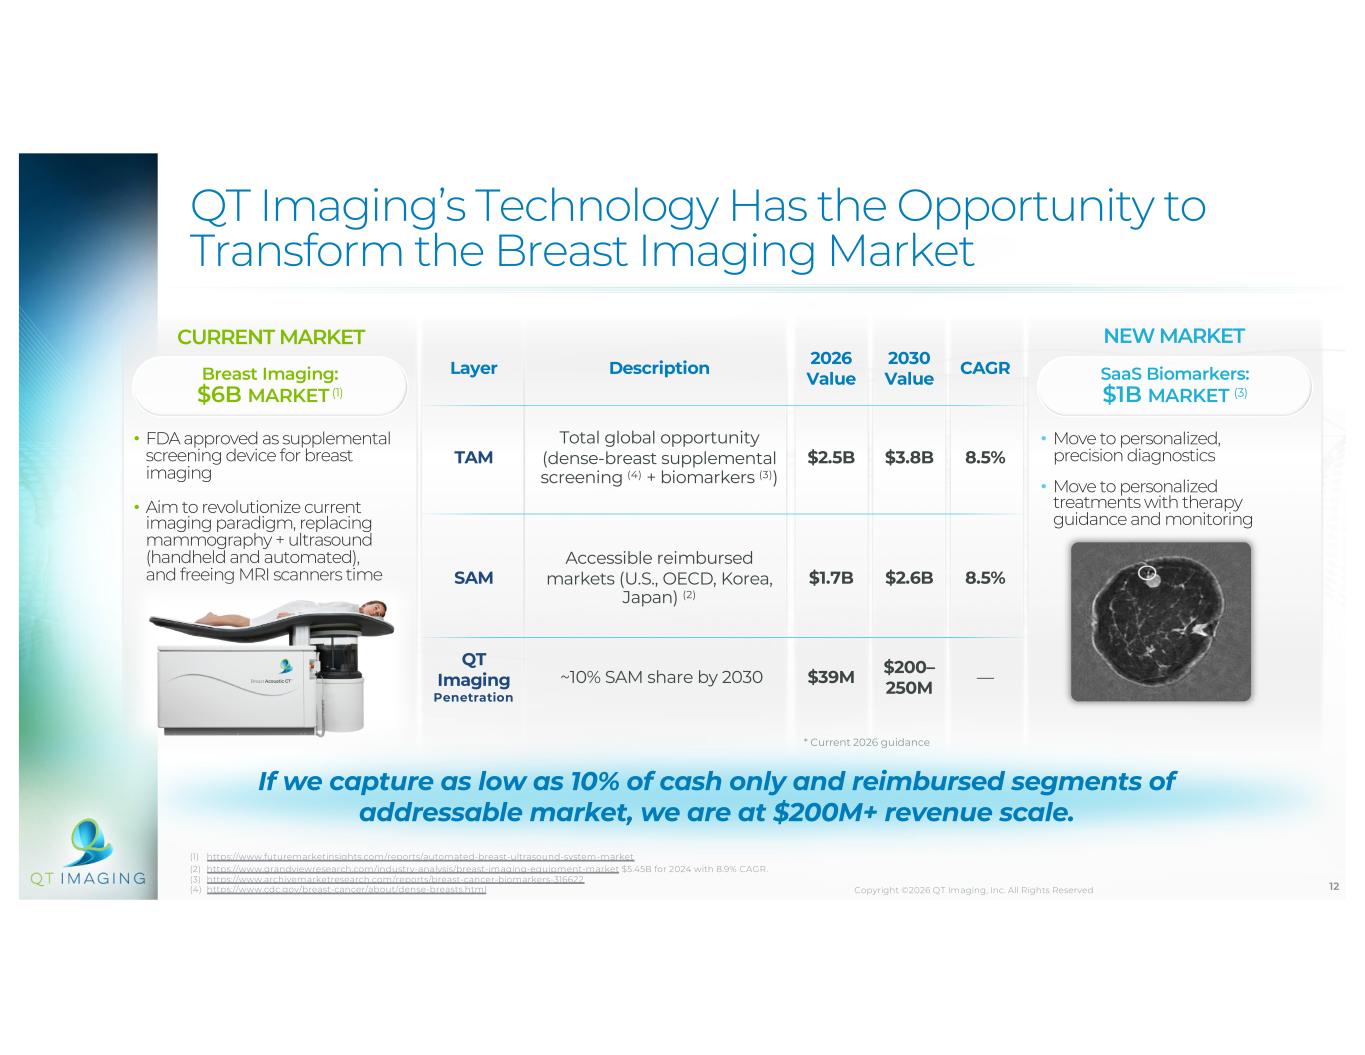
12 (1) https://www.futuremarketinsights.com/reports/automated-breast-ultrasound-system-market (2) https://www.grandviewresearch.com/industry-analysis/breast-imaging-equipment-market $5.45B for 2024 with 8.9% CAGR. (3) https://www.archivemarketresearch.com/reports/breast-cancer-biomarkers-316622 (4) https://www.cdc.gov/breast-cancer/about/dense-breasts.html NEW MARKET • Move to personalized, precision diagnostics • Move to personalized treatments with therapy guidance and monitoring QT Imaging’s Technology Has the Opportunity to Transform the Breast Imaging Market CURRENT MARKET • FDA approved as supplemental screening device for breast imaging • Aim to revolutionize current imaging paradigm, replacing mammography + ultrasound (handheld and automated), and freeing MRI scanners time SaaS Biomarkers: $1B MARKET (3) Breast Imaging: $6B MARKET (1) Layer Description 2026 Value 2030 Value CAGR TAM Total global opportunity (dense-breast supplemental screening (4) + biomarkers (3)) $2.5B $3.8B 8.5% SAM Accessible reimbursed markets (U.S., OECD, Korea, Japan) (2) $1.7B $2.6B 8.5% QT Imaging Penetration ~10% SAM share by 2030 $39M $200– 250M — If we capture as low as 10% of cash only and reimbursed segments of addressable market, we are at $200M+ revenue scale. Copyright ©2026 QT Imaging, Inc. All Rights Reserved * Current 2026 guidance
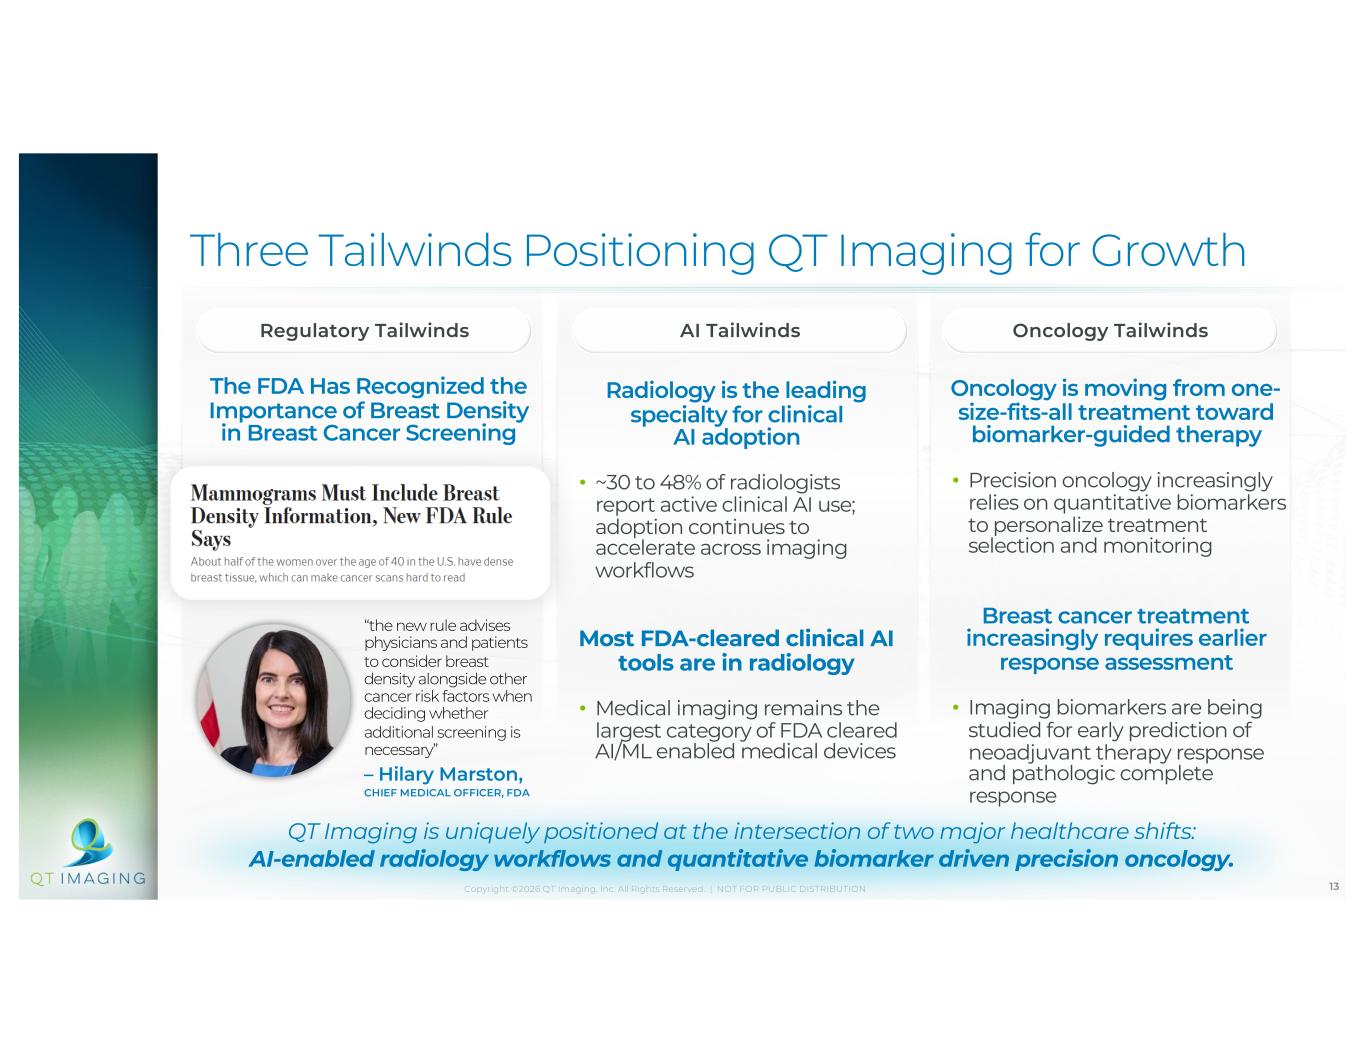
13Copyright ©2026 QT Imaging, Inc. All Rights Reserved. | NOT FOR PUBLIC DISTRIBUTION The FDA Has Recognized the Importance of Breast Density in Breast Cancer Screening Radiology is the leading specialty for clinical AI adoption • ~30 to 48% of radiologists report active clinical AI use; adoption continues to accelerate across imaging workflows Most FDA-cleared clinical AI tools are in radiology • Medical imaging remains the largest category of FDA cleared AI/ML enabled medical devices Three Tailwinds Positioning QT Imaging for Growth “the new rule advises physicians and patients to consider breast density alongside other cancer risk factors when deciding whether additional screening is necessary” – Hilary Marston, CHIEF MEDICAL OFFICER, FDA Oncology is moving from one- size-fits-all treatment toward biomarker-guided therapy • Precision oncology increasingly relies on quantitative biomarkers to personalize treatment selection and monitoring Breast cancer treatment increasingly requires earlier response assessment • Imaging biomarkers are being studied for early prediction of neoadjuvant therapy response and pathologic complete response QT Imaging is uniquely positioned at the intersection of two major healthcare shifts: AI-enabled radiology workflows and quantitative biomarker driven precision oncology. Regulatory Tailwinds AI Tailwinds Oncology Tailwinds
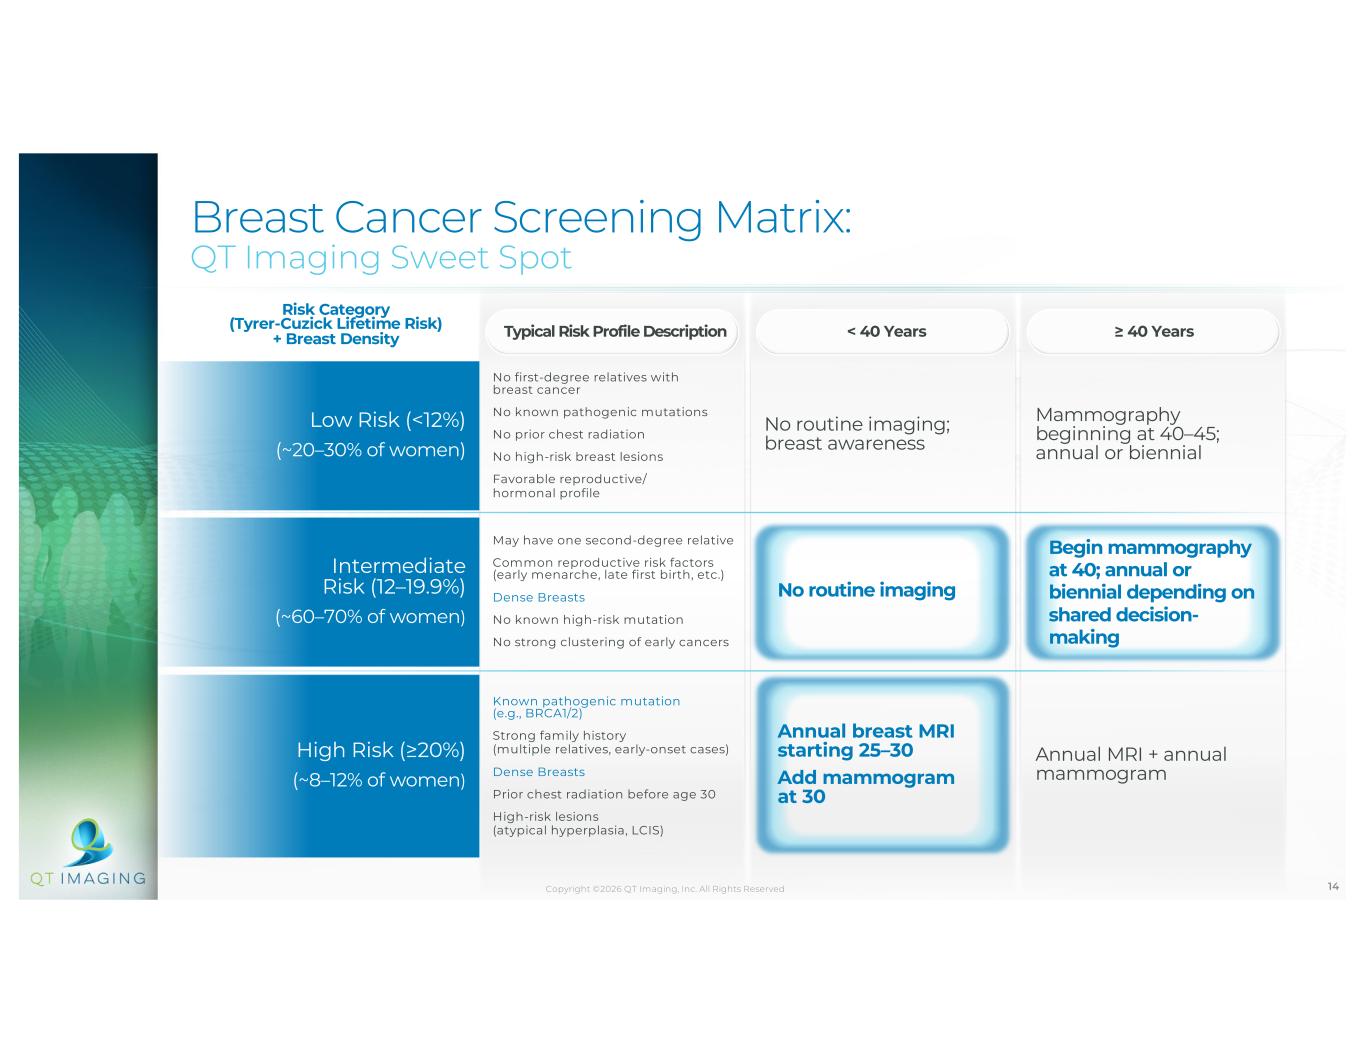
14 Breast Cancer Screening Matrix: QT Imaging Sweet Spot Risk Category (Tyrer-Cuzick Lifetime Risk) + Breast Density Typical Risk Profile Description < 40 Years ≥ 40 Years Low Risk (<12%) (~20–30% of women) No first-degree relatives with breast cancer No known pathogenic mutations No prior chest radiation No high-risk breast lesions Favorable reproductive/ hormonal profile No routine imaging; breast awareness Mammography beginning at 40–45; annual or biennial Intermediate Risk (12–19.9%) (~60–70% of women) May have one second-degree relative Common reproductive risk factors (early menarche, late first birth, etc.) Dense Breasts No known high-risk mutation No strong clustering of early cancers No routine imaging Begin mammography at 40; annual or biennial depending on shared decision- making High Risk (≥20%) (~8–12% of women) Known pathogenic mutation (e.g., BRCA1/2) Strong family history (multiple relatives, early-onset cases) Dense Breasts Prior chest radiation before age 30 High-risk lesions (atypical hyperplasia, LCIS) Annual breast MRI starting 25–30 Add mammogram at 30 Annual MRI + annual mammogram Copyright ©2026 QT Imaging, Inc. All Rights Reserved
Validation
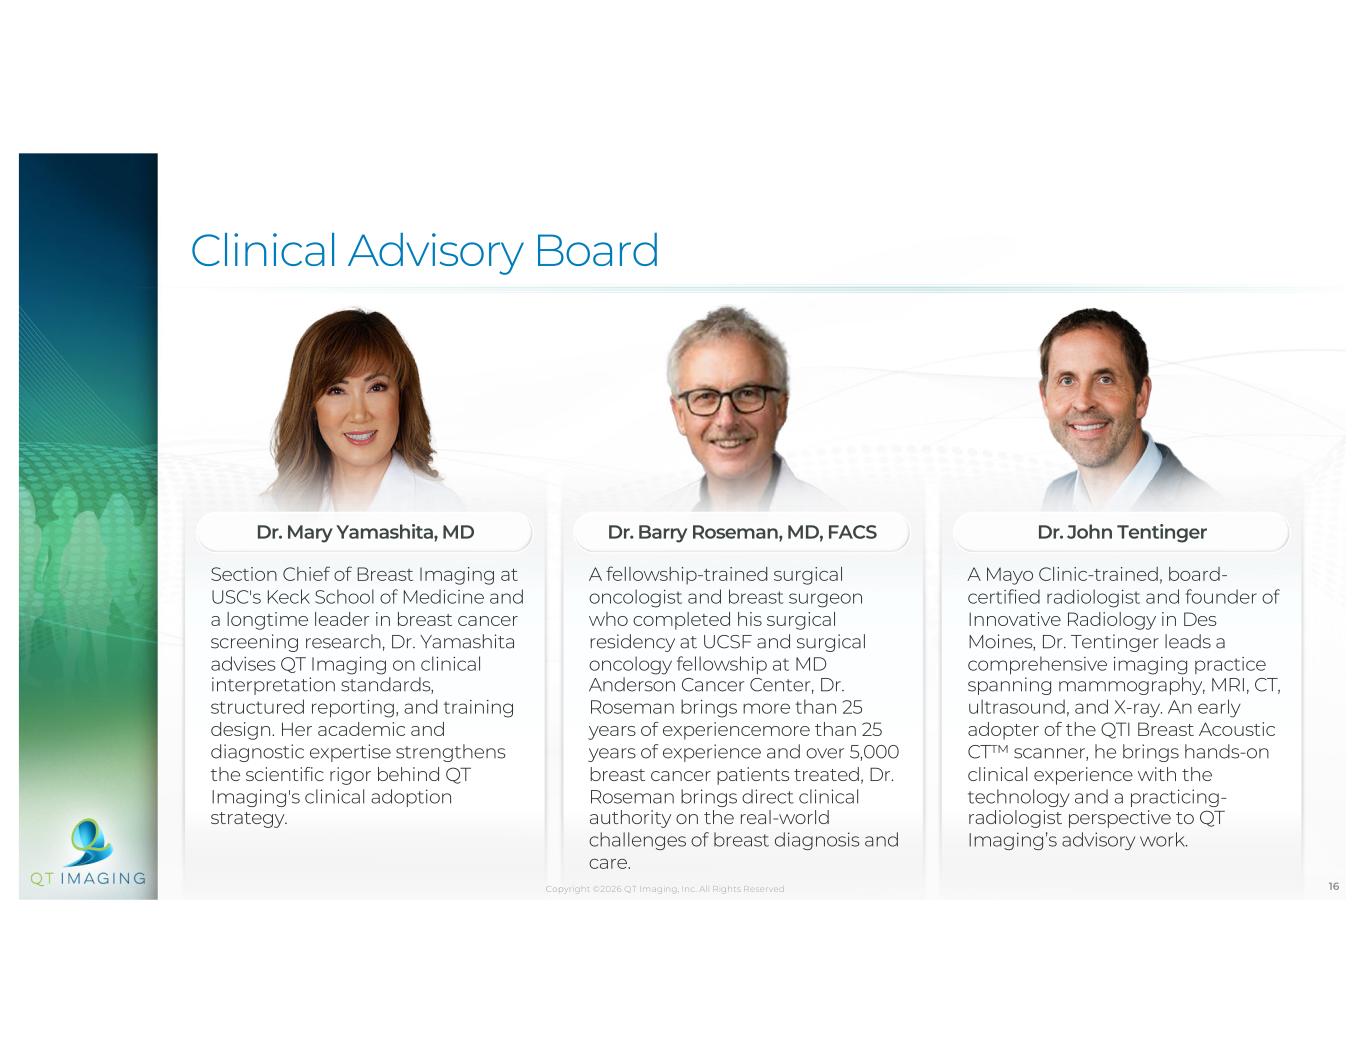
16 Clinical Advisory Board Copyright ©2026 QT Imaging, Inc. All Rights Reserved Dr. Mary Yamashita, MD Dr. Barry Roseman, MD, FACS Dr. John Tentinger Section Chief of Breast Imaging at USC's Keck School of Medicine and a longtime leader in breast cancer screening research, Dr. Yamashita advises QT Imaging on clinical interpretation standards, structured reporting, and training design. Her academic and diagnostic expertise strengthens the scientific rigor behind QT Imaging's clinical adoption strategy. A fellowship-trained surgical oncologist and breast surgeon who completed his surgical residency at UCSF and surgical oncology fellowship at MD Anderson Cancer Center, Dr. Roseman brings more than 25 years of experiencemore than 25 years of experience and over 5,000 breast cancer patients treated, Dr. Roseman brings direct clinical authority on the real-world challenges of breast diagnosis and care. A Mayo Clinic-trained, board- certified radiologist and founder of Innovative Radiology in Des Moines, Dr. Tentinger leads a comprehensive imaging practice spanning mammography, MRI, CT, ultrasound, and X-ray. An early adopter of the QTI Breast Acoustic CT™ scanner, he brings hands-on clinical experience with the technology and a practicing- radiologist perspective to QT Imaging’s advisory work.
17 Growing Global Validation • Existing FDA clearance to offer an imaging modality for all patients above 18 years old •Received Saudi Arabia, UAE, and Israel regulatory approvals •NIH $18M funding to generate a safe imaging modality for women with dense breasts •Ongoing clinical studies at: −Mayo Clinic −Sunnybrook Cancer Center −To start soon: Stanford − In discussions: UCSF, Harvard • Category III code, X579T NIH has awarded QT Imaging about $18M for new women’s imaging solution Copyright ©2026 QT Imaging, Inc. All Rights Reserved
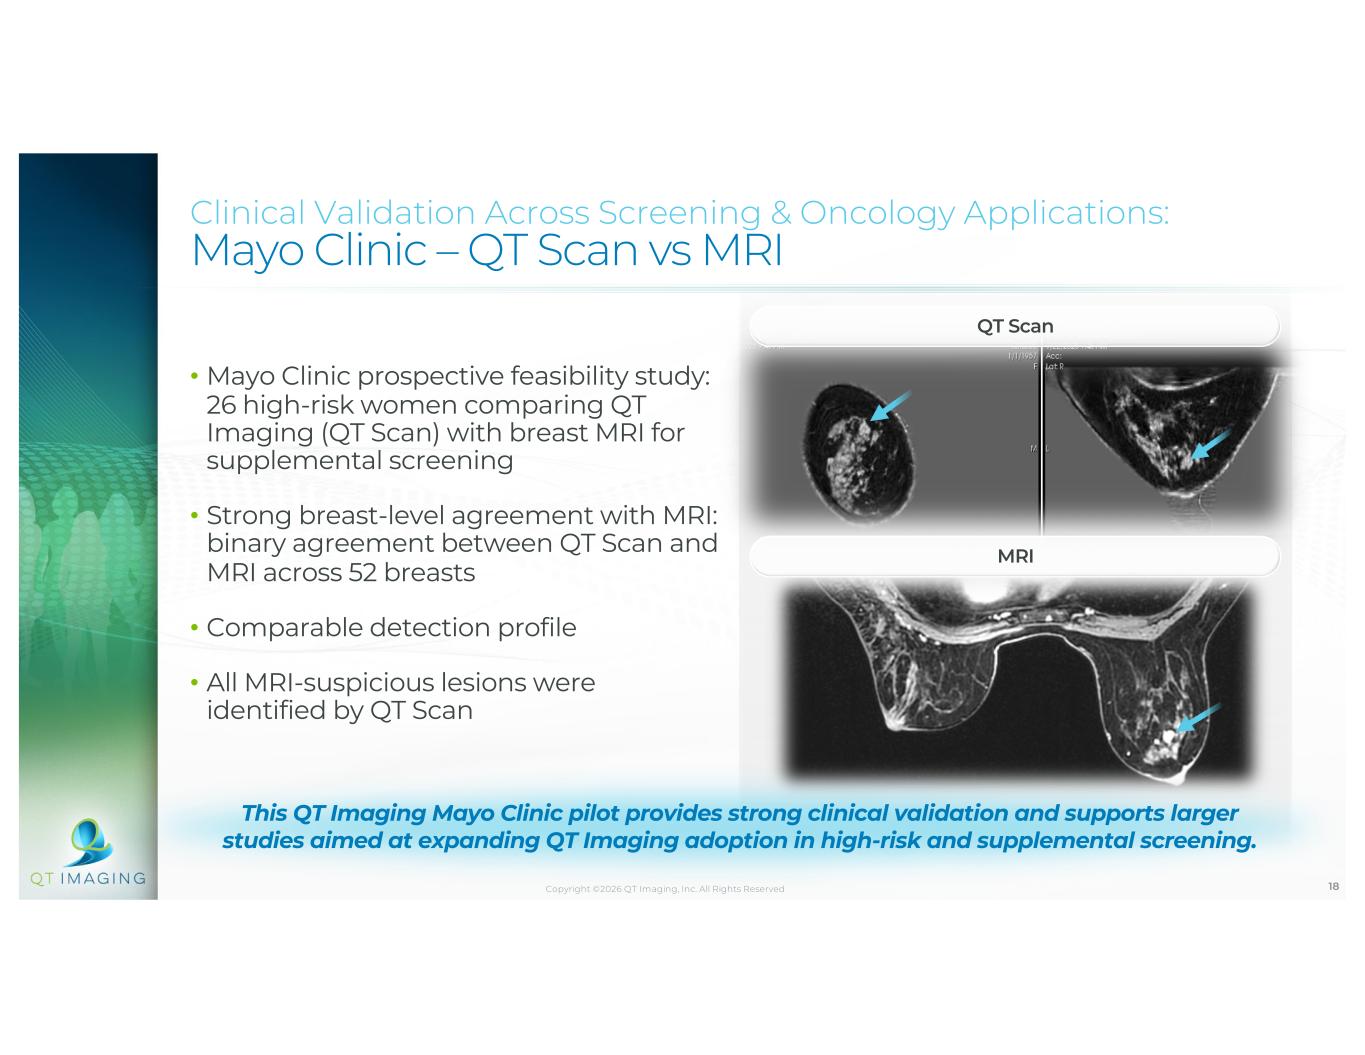
18 Clinical Validation Across Screening & Oncology Applications: Mayo Clinic – QT Scan vs MRI • Mayo Clinic prospective feasibility study: 26 high-risk women comparing QT Imaging (QT Scan) with breast MRI for supplemental screening • Strong breast-level agreement with MRI: binary agreement between QT Scan and MRI across 52 breasts • Comparable detection profile • All MRI-suspicious lesions were identified by QT Scan This QT Imaging Mayo Clinic pilot provides strong clinical validation and supports larger studies aimed at expanding QT Imaging adoption in high-risk and supplemental screening. QT Scan MRI Copyright ©2026 QT Imaging, Inc. All Rights Reserved
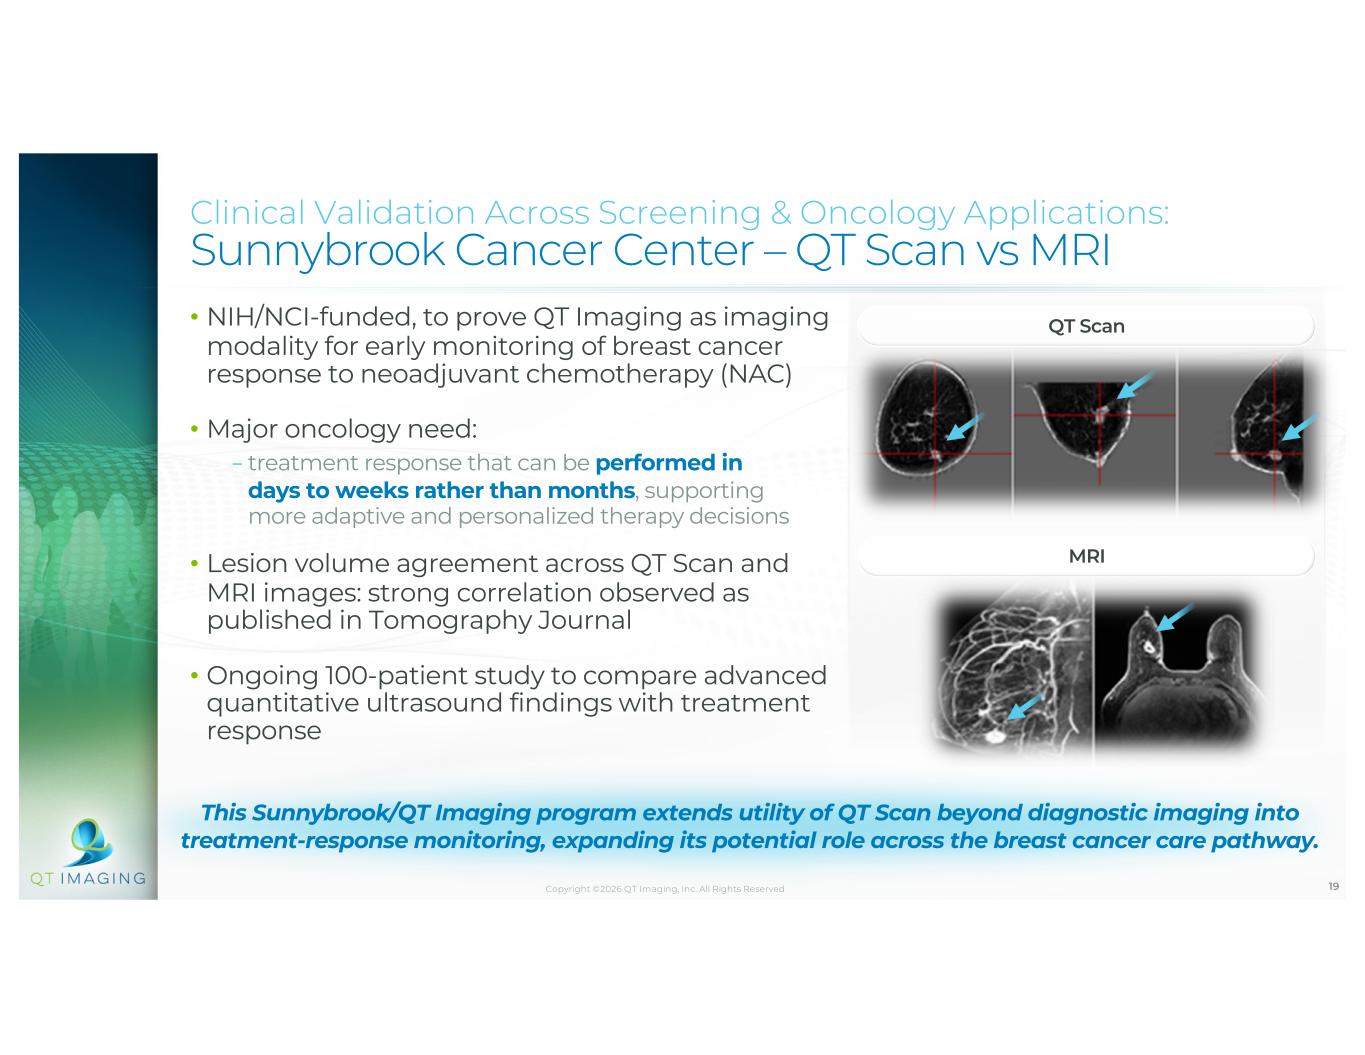
19 MRI Clinical Validation Across Screening & Oncology Applications: Sunnybrook Cancer Center – QT Scan vs MRI • NIH/NCI-funded, to prove QT Imaging as imaging modality for early monitoring of breast cancer response to neoadjuvant chemotherapy (NAC) • Major oncology need: − treatment response that can be performed in days to weeks rather than months, supporting more adaptive and personalized therapy decisions • Lesion volume agreement across QT Scan and MRI images: strong correlation observed as published in Tomography Journal • Ongoing 100-patient study to compare advanced quantitative ultrasound findings with treatment response This Sunnybrook/QT Imaging program extends utility of QT Scan beyond diagnostic imaging into treatment-response monitoring, expanding its potential role across the breast cancer care pathway. QT Scan Copyright ©2026 QT Imaging, Inc. All Rights Reserved
20Copyright ©2026 QT Imaging, Inc. All Rights Reserved. Multi-site Repeatability & Reproducibility Study • Multi-site study (2 sites, 5 patients/site, 5 scans each) confirms QT Imaging's quantitative biomarkers are highly reproducible within and across scanners • Speed of Sound (SoS), our core tissue biomarker, showed less than 1% variability, a level of precision that distinguishes true biological change from measurement noise • Derived volumetric measures remained tight: Total Breast Volume varied ~5%, and the FGV/TBV density ratio varied ~12% • By comparison, published breast MRI biomarkers (QIBA ADC benchmark; Aliu et al.) show variability of 11–22% - meaningfully less reproducible than our platform • This reproducibility is a key prerequisite for using QT biomarkers in longitudinal monitoring and treatment-response tracking, not just single-timepoint screening Reinforces QTI’s differentiation: an objective, operator-independent platform built for consistent, data-driven breast health assessment
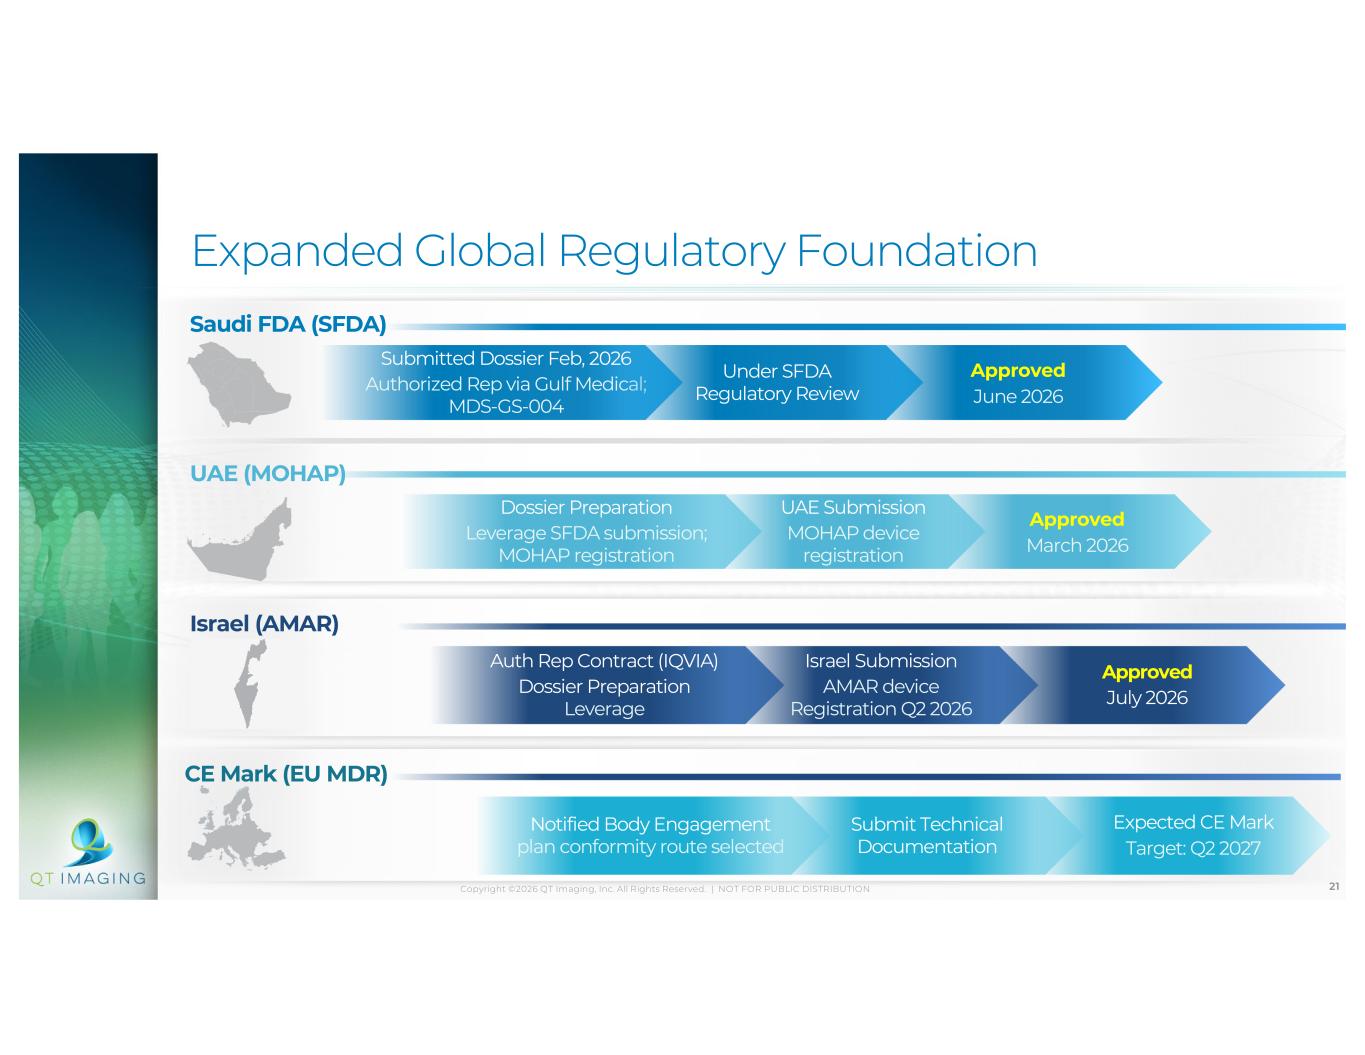
21Copyright ©2026 QT Imaging, Inc. All Rights Reserved. | NOT FOR PUBLIC DISTRIBUTION Expanded Global Regulatory Foundation Saudi FDA (SFDA) UAE (MOHAP) Submitted Dossier Feb, 2026 Authorized Rep via Gulf Medical; MDS-GS-004 Under SFDA Regulatory Review Approved June 2026 Dossier Preparation Leverage SFDA submission; MOHAP registration UAE Submission MOHAP device registration Approved March 2026 Auth Rep Contract (IQVIA) Dossier Preparation Leverage Israel Submission AMAR device Registration Q2 2026 Approved July 2026 Israel (AMAR) Notified Body Engagement plan conformity route selected Submit Technical Documentation Expected CE Mark Target: Q2 2027 CE Mark (EU MDR)
Business Model, Partnerships & Financial Trajectory
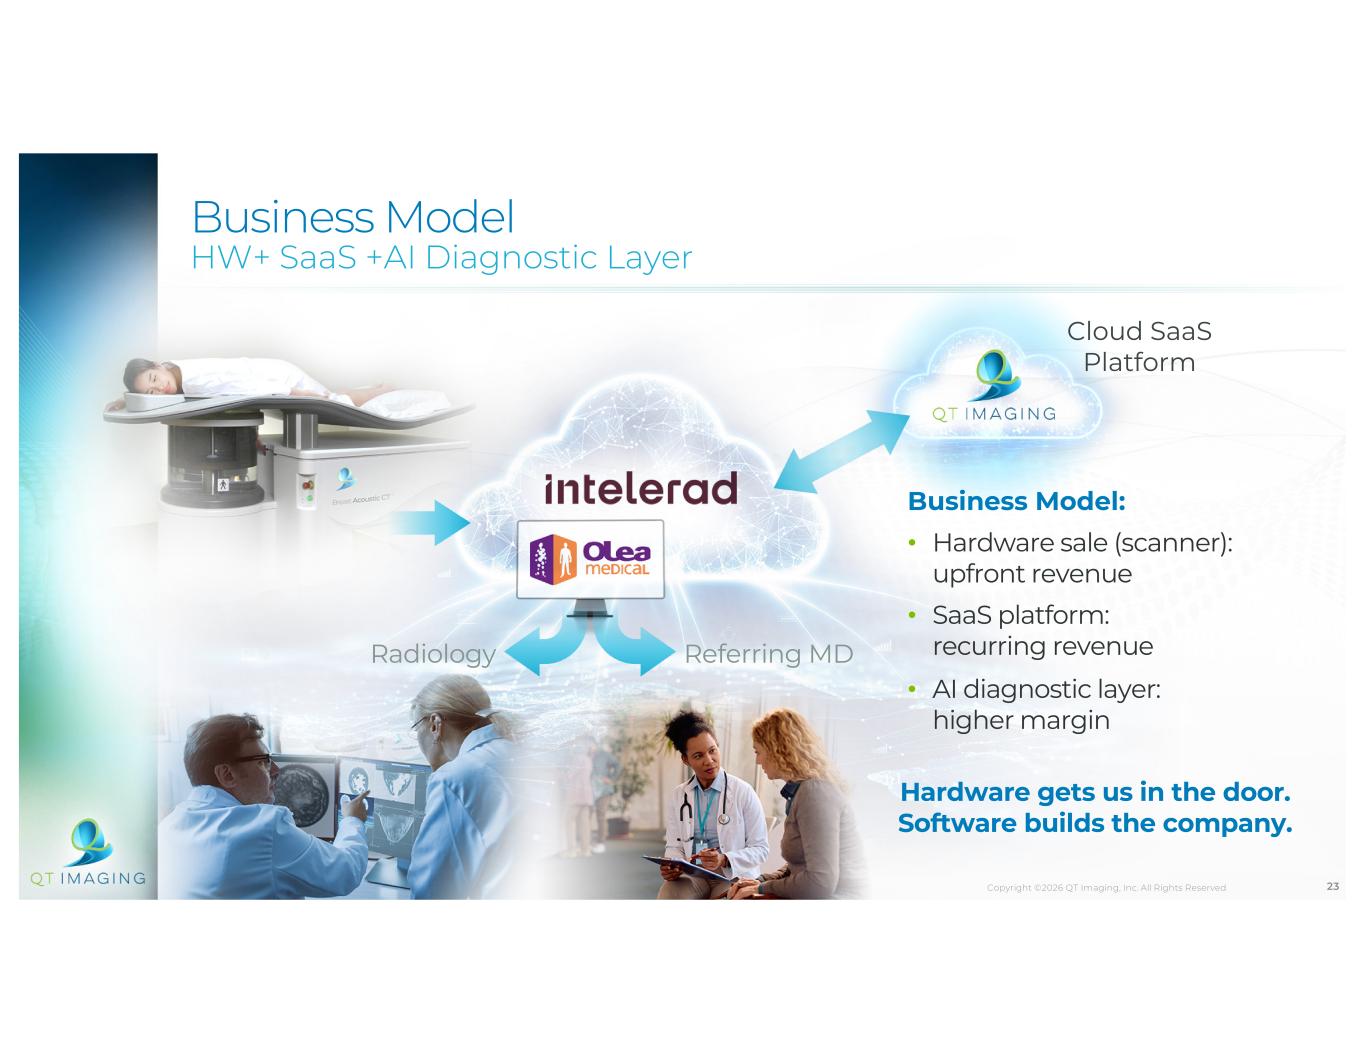
23 Business Model HW+ SaaS +AI Diagnostic Layer Business Model: • Hardware sale (scanner): upfront revenue • SaaS platform: recurring revenue • AI diagnostic layer: higher margin Radiology Cloud SaaS Platform Referring MD Hardware gets us in the door. Software builds the company. Copyright ©2026 QT Imaging, Inc. All Rights Reserved
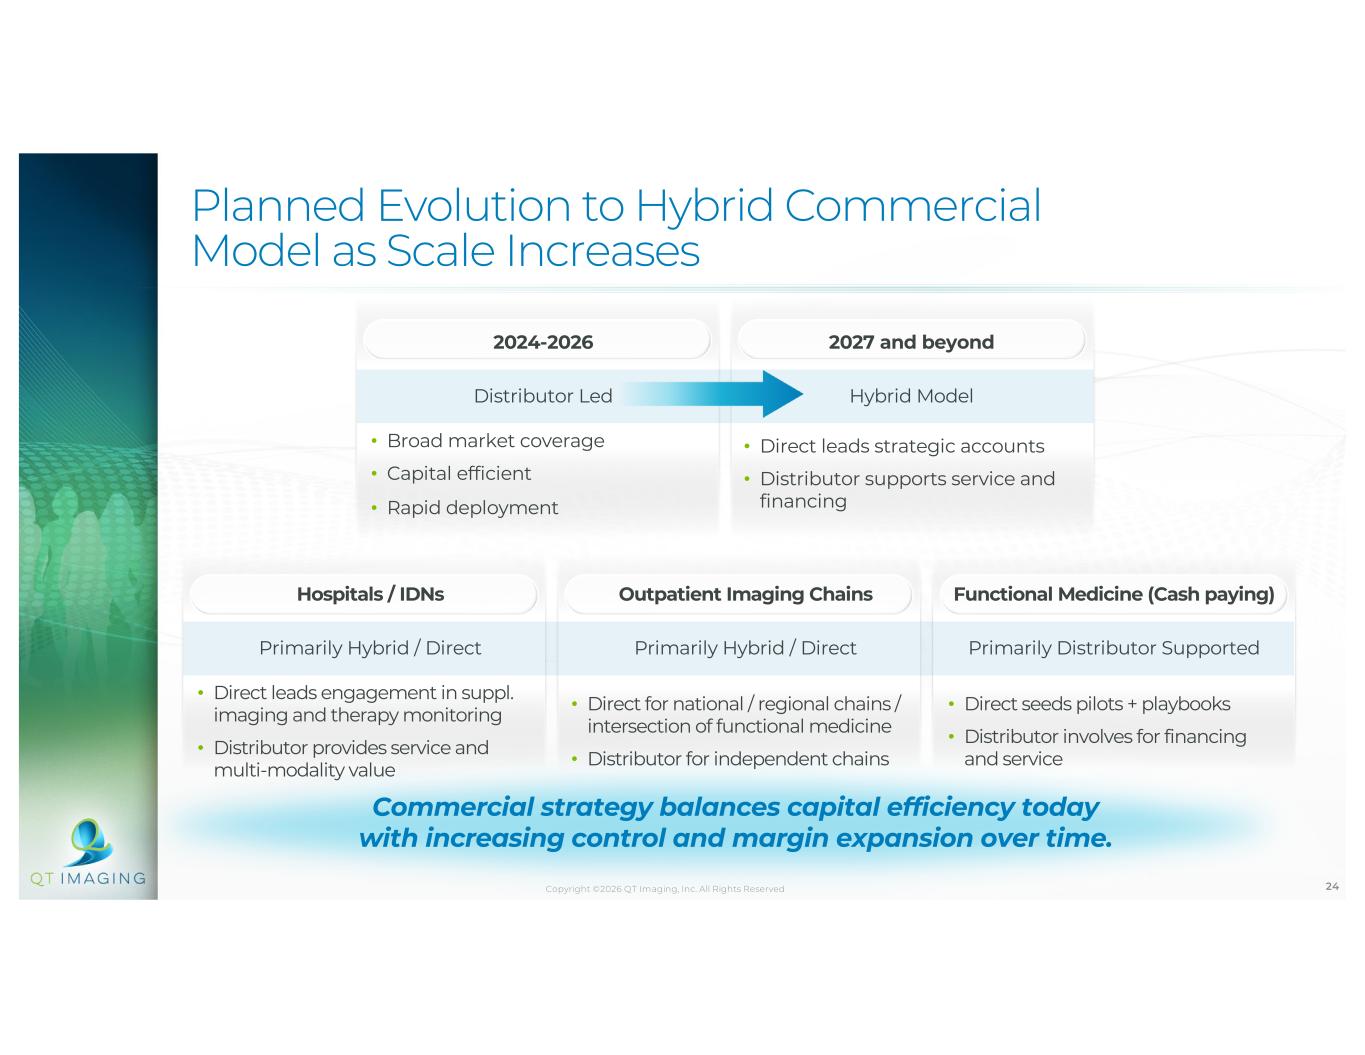
24 Planned Evolution to Hybrid Commercial Model as Scale Increases Commercial strategy balances capital efficiency today with increasing control and margin expansion over time. 2024-2026 2027 and beyond Distributor Led Hybrid Model • Broad market coverage • Capital efficient • Rapid deployment • Direct leads strategic accounts • Distributor supports service and financing Hospitals / IDNs Outpatient Imaging Chains Functional Medicine (Cash paying) Primarily Hybrid / Direct Primarily Hybrid / Direct Primarily Distributor Supported • Direct leads engagement in suppl. imaging and therapy monitoring • Distributor provides service and multi-modality value • Direct for national / regional chains / intersection of functional medicine • Distributor for independent chains • Direct seeds pilots + playbooks • Distributor involves for financing and service Copyright ©2026 QT Imaging, Inc. All Rights Reserved

25Copyright ©2026 QT Imaging, Inc. All Rights Reserved. Business Partnerships Today Under Distribution Agreement with NXC Imaging (Subsidiary of Canon Medical Systems) for U.S. market Under Distribution Agreement with Gulf Medical for Kingdom of Saudi Arabia (KSA) market Under Distribution Agreement with Al Naghi Medical for the United Arab Emirates Territory Under Distribution Agreement with Re- Invent Pharma for the Pakistani Market
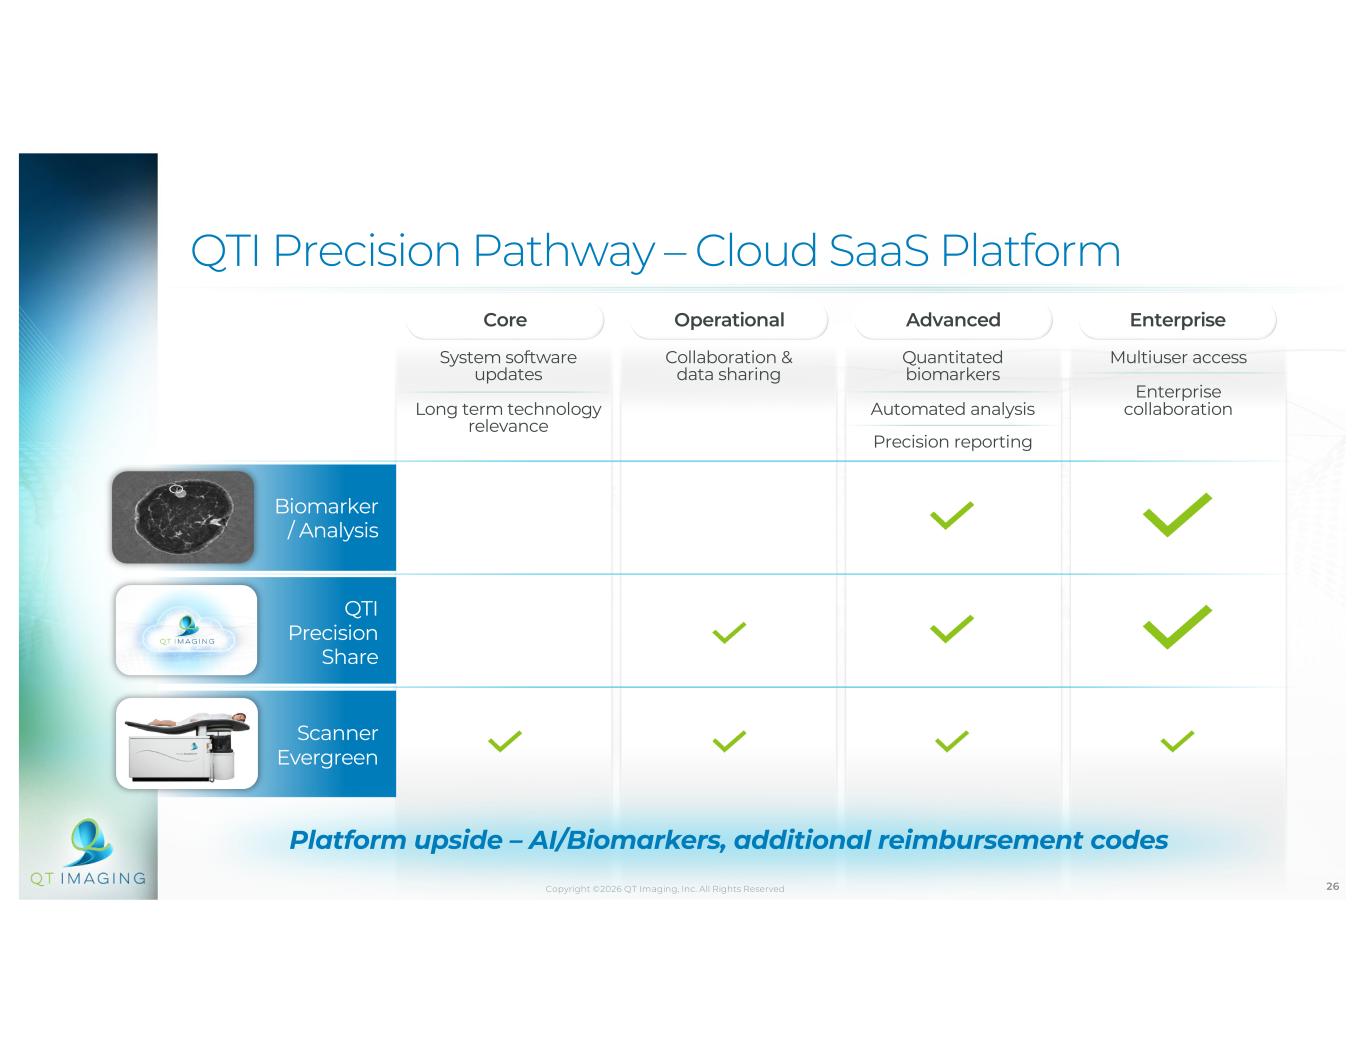
26 QTI Precision Pathway – Cloud SaaS Platform Core Operational Advanced Enterprise System software updates Long term technology relevance Collaboration & data sharing Quantitated biomarkers Automated analysis Precision reporting Multiuser access Enterprise collaboration Scanner Evergreen QTI Precision Share Biomarker / Analysis Platform upside – AI/Biomarkers, additional reimbursement codes Copyright ©2026 QT Imaging, Inc. All Rights Reserved
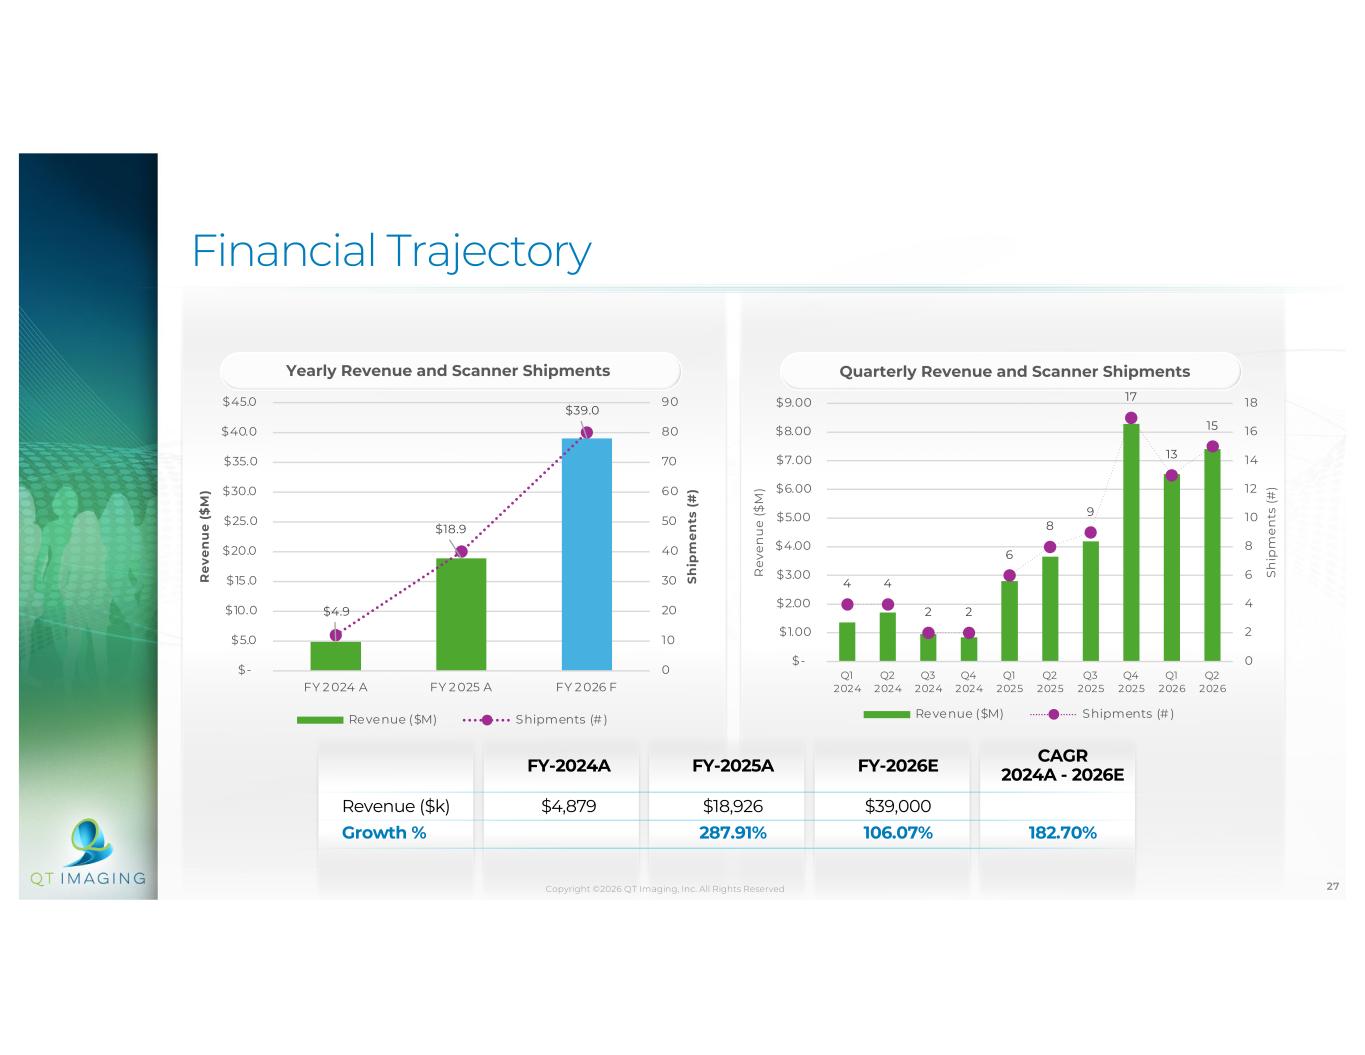
27 Financial Trajectory $4.9 $18.9 $39.0 0 10 20 30 40 50 60 70 80 90 $- $5.0 $10.0 $15 .0 $20.0 $25.0 $30.0 $35.0 $40.0 $45.0 FY 2 024 A FY 2 025 A FY 2 026 F S h ip m e n ts ( # ) R e ve n u e ( $ M ) Yearly Revenue and Scanner Shipments Revenue ($M) Shipments (# ) FY-2024A FY-2025A FY-2026E CAGR 2024A - 2026E Revenue ($k) $4,879 $18,926 $39,000 Growth % 287.91% 106.07% 182.70% Copyright ©2026 QT Imaging, Inc. All Rights Reserved 4 4 2 2 6 8 9 17 13 15 0 2 4 6 8 10 12 14 16 18 $- $1.00 $2.00 $3.00 $4.00 $5.00 $6.00 $7.00 $8.00 $9.00 Q1 2024 Q2 2024 Q3 2024 Q4 2024 Q1 2025 Q2 2025 Q3 2025 Q4 2025 Q1 2026 Q2 2026 S h ip m en ts (# ) R ev en u e ($ M ) Quarterly Revenue and Scanner Shipments Revenue ($M) Shipments (# )
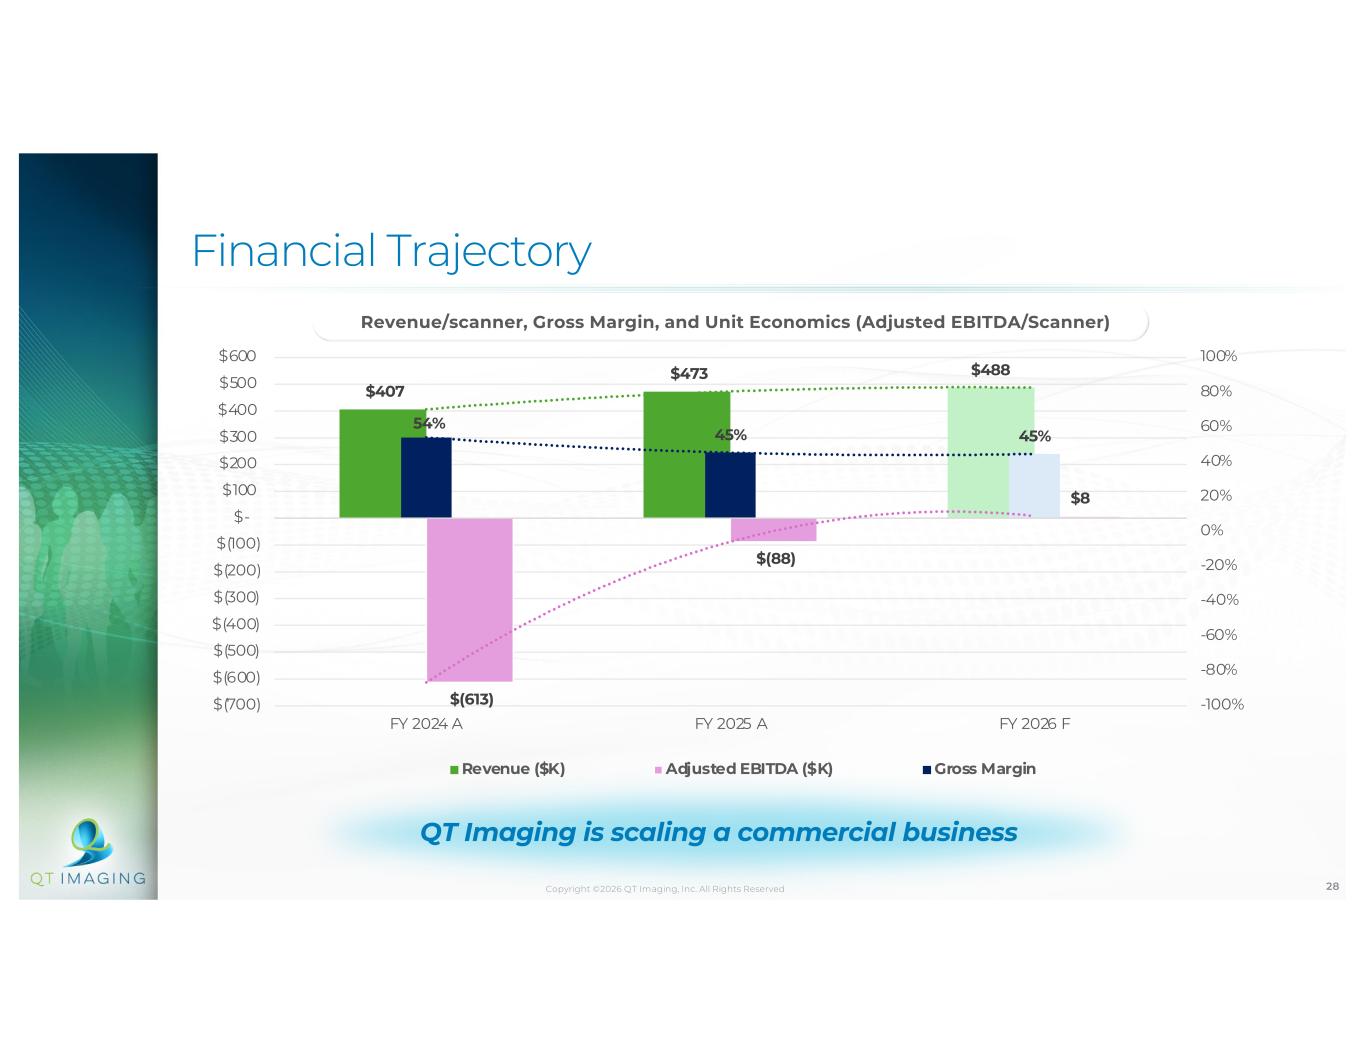
28 Financial Trajectory QT Imaging is scaling a commercial business $407 $473 $488 $(613) $(88) $8 54% 45% 45% -100% -80% -60% -40% -20% 0% 20% 40% 60% 80% 100% $(700) $(600) $(500) $(400) $(300) $(200) $(100) $- $100 $200 $300 $400 $500 $600 FY 2024 A FY 2025 A FY 2026 F Revenue/scanner, Gross Margin, and Unit Economics (Adjusted EBITDA/Scanner) Revenue ($K) Adjusted EBITDA ($K) Gross Margin Copyright ©2026 QT Imaging, Inc. All Rights Reserved

29 Manufacturing Capacity, Quality, and Compliance • Expanded manufacturing capacity while improving operating efficiency − 22,000-square-foot headquarters and manufacturing facility − The expanded facility provides more than 2.5x the operational space of the current location while reducing lease cost per square foot by approximately 55% • Successfully completed the Company’s first routine FDA inspection − The inspection concluded with zero Form 483 observations, reflecting the strength of the Company’s Quality Management System and its focus on quality, compliance and manufacturing readiness Copyright ©2026 QT Imaging Holdings, Inc. All Rights Reserved. PETALUMA, CALIFORNIA
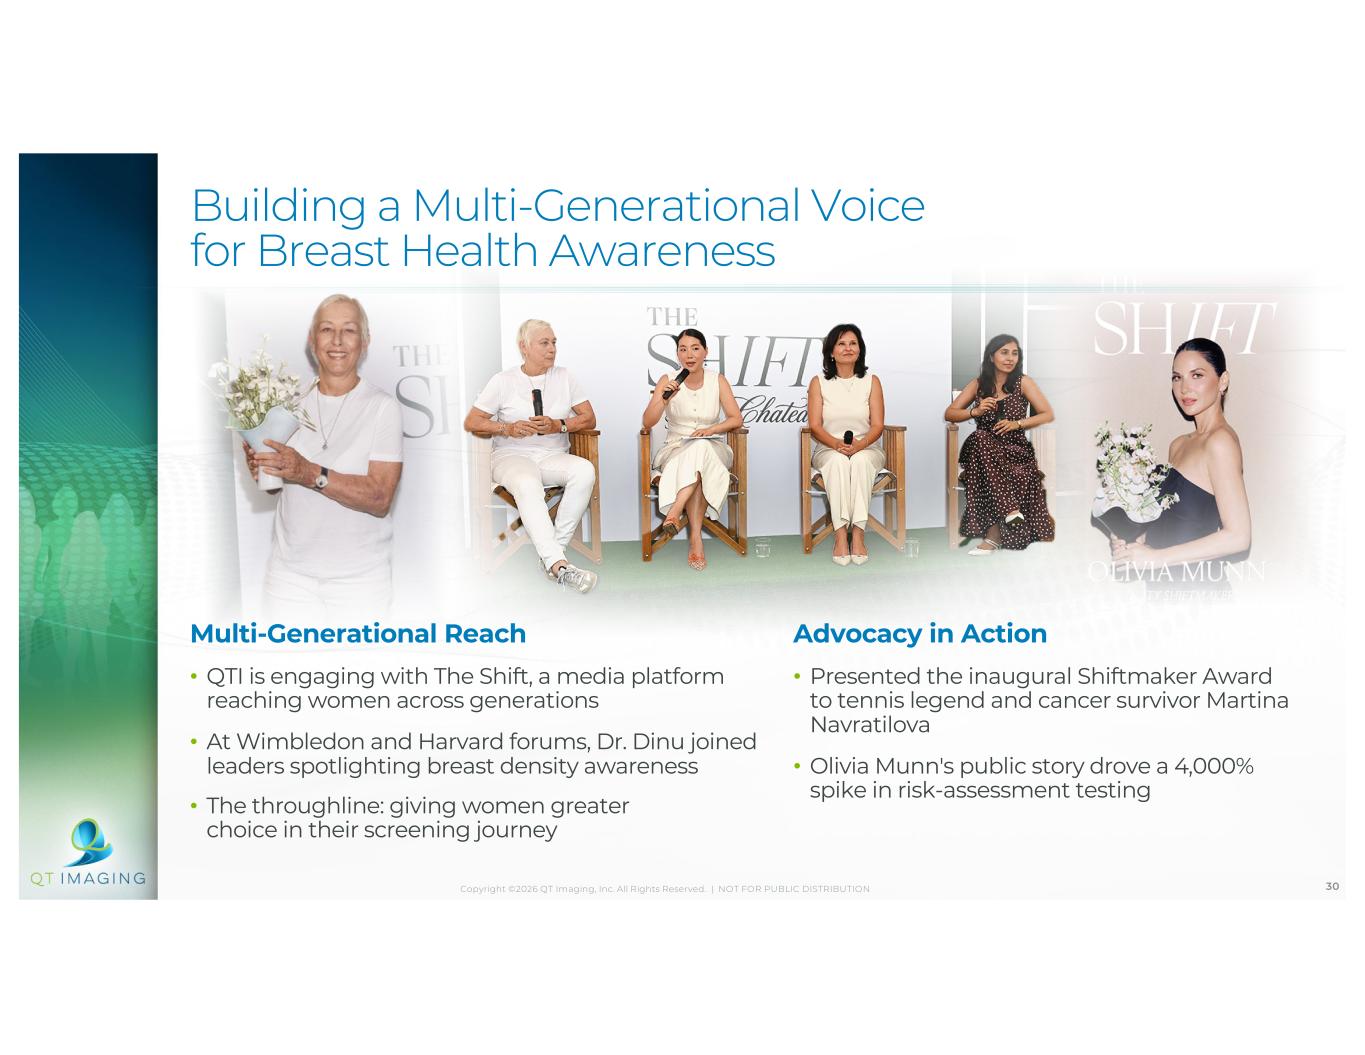
30Copyright ©2026 QT Imaging, Inc. All Rights Reserved. | NOT FOR PUBLIC DISTRIBUTION Multi-Generational Reach • QTI is engaging with The Shift, a media platform reaching women across generations • At Wimbledon and Harvard forums, Dr. Dinu joined leaders spotlighting breast density awareness • The throughline: giving women greater choice in their screening journey Advocacy in Action • Presented the inaugural Shiftmaker Award to tennis legend and cancer survivor Martina Navratilova • Olivia Munn's public story drove a 4,000% spike in risk-assessment testing Building a Multi-Generational Voice for Breast Health Awareness
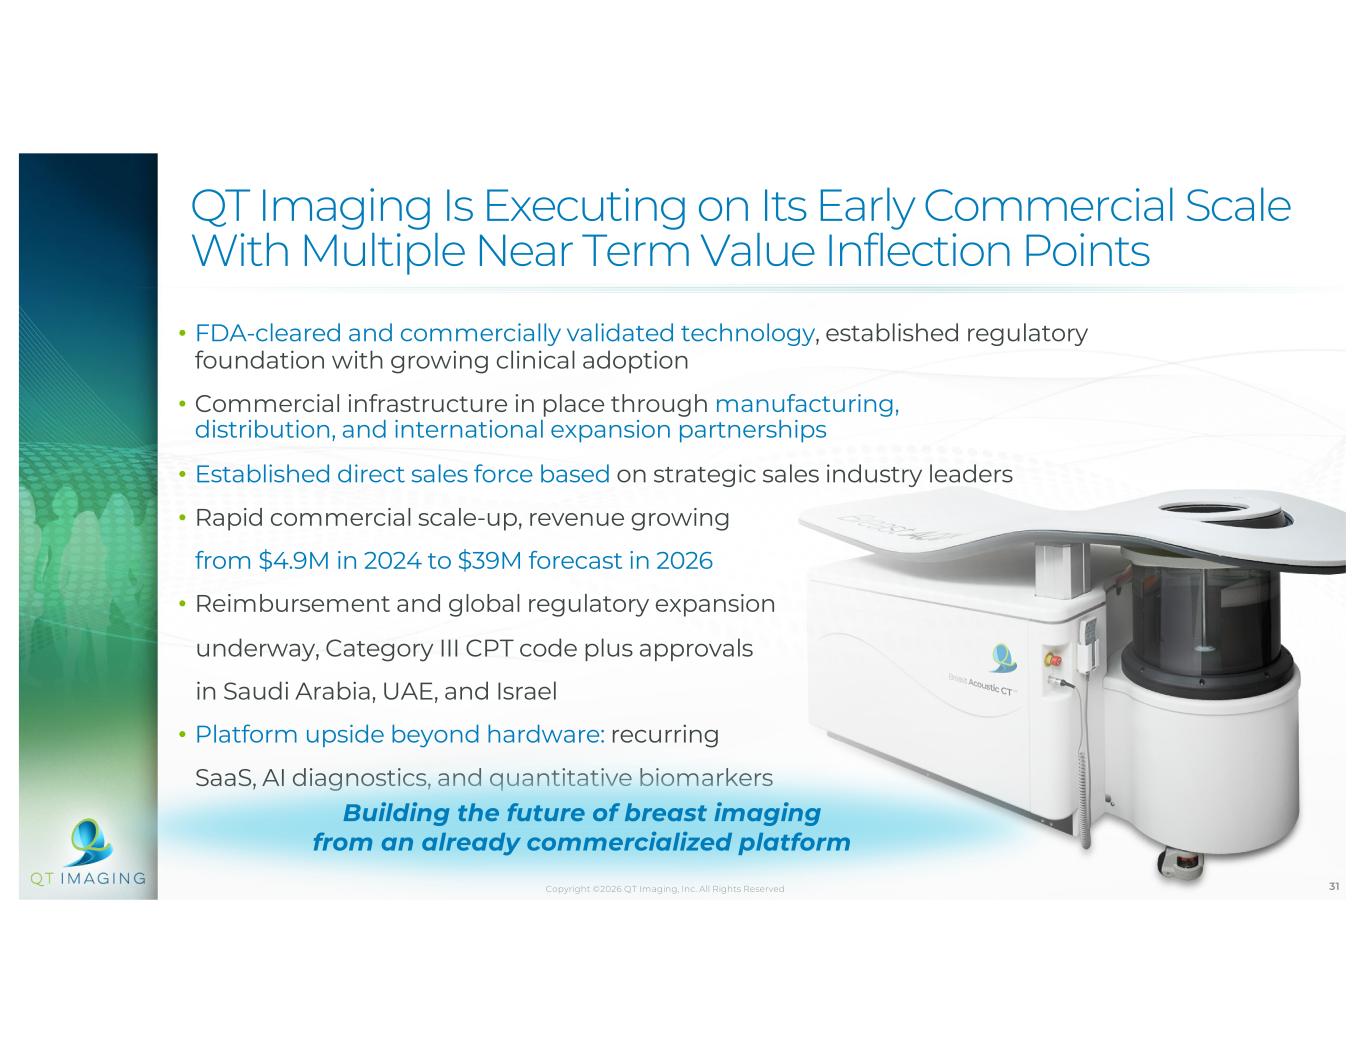
31 QT Imaging Is Executing on Its Early Commercial Scale With Multiple Near Term Value Inflection Points • FDA-cleared and commercially validated technology, established regulatory foundation with growing clinical adoption • Commercial infrastructure in place through manufacturing, distribution, and international expansion partnerships • Established direct sales force based on strategic sales industry leaders • Rapid commercial scale-up, revenue growing from $4.9M in 2024 to $39M forecast in 2026 • Reimbursement and global regulatory expansion underway, Category III CPT code plus approvals in Saudi Arabia, UAE, and Israel • Platform upside beyond hardware: recurring SaaS, AI diagnostics, and quantitative biomarkers Building the future of breast imaging from an already commercialized platform Copyright ©2026 QT Imaging, Inc. All Rights Reserved
Thank You!